


WHERE WOULD YOU LIKE TO LIVE?
Fraser Valley Market Report Infographics
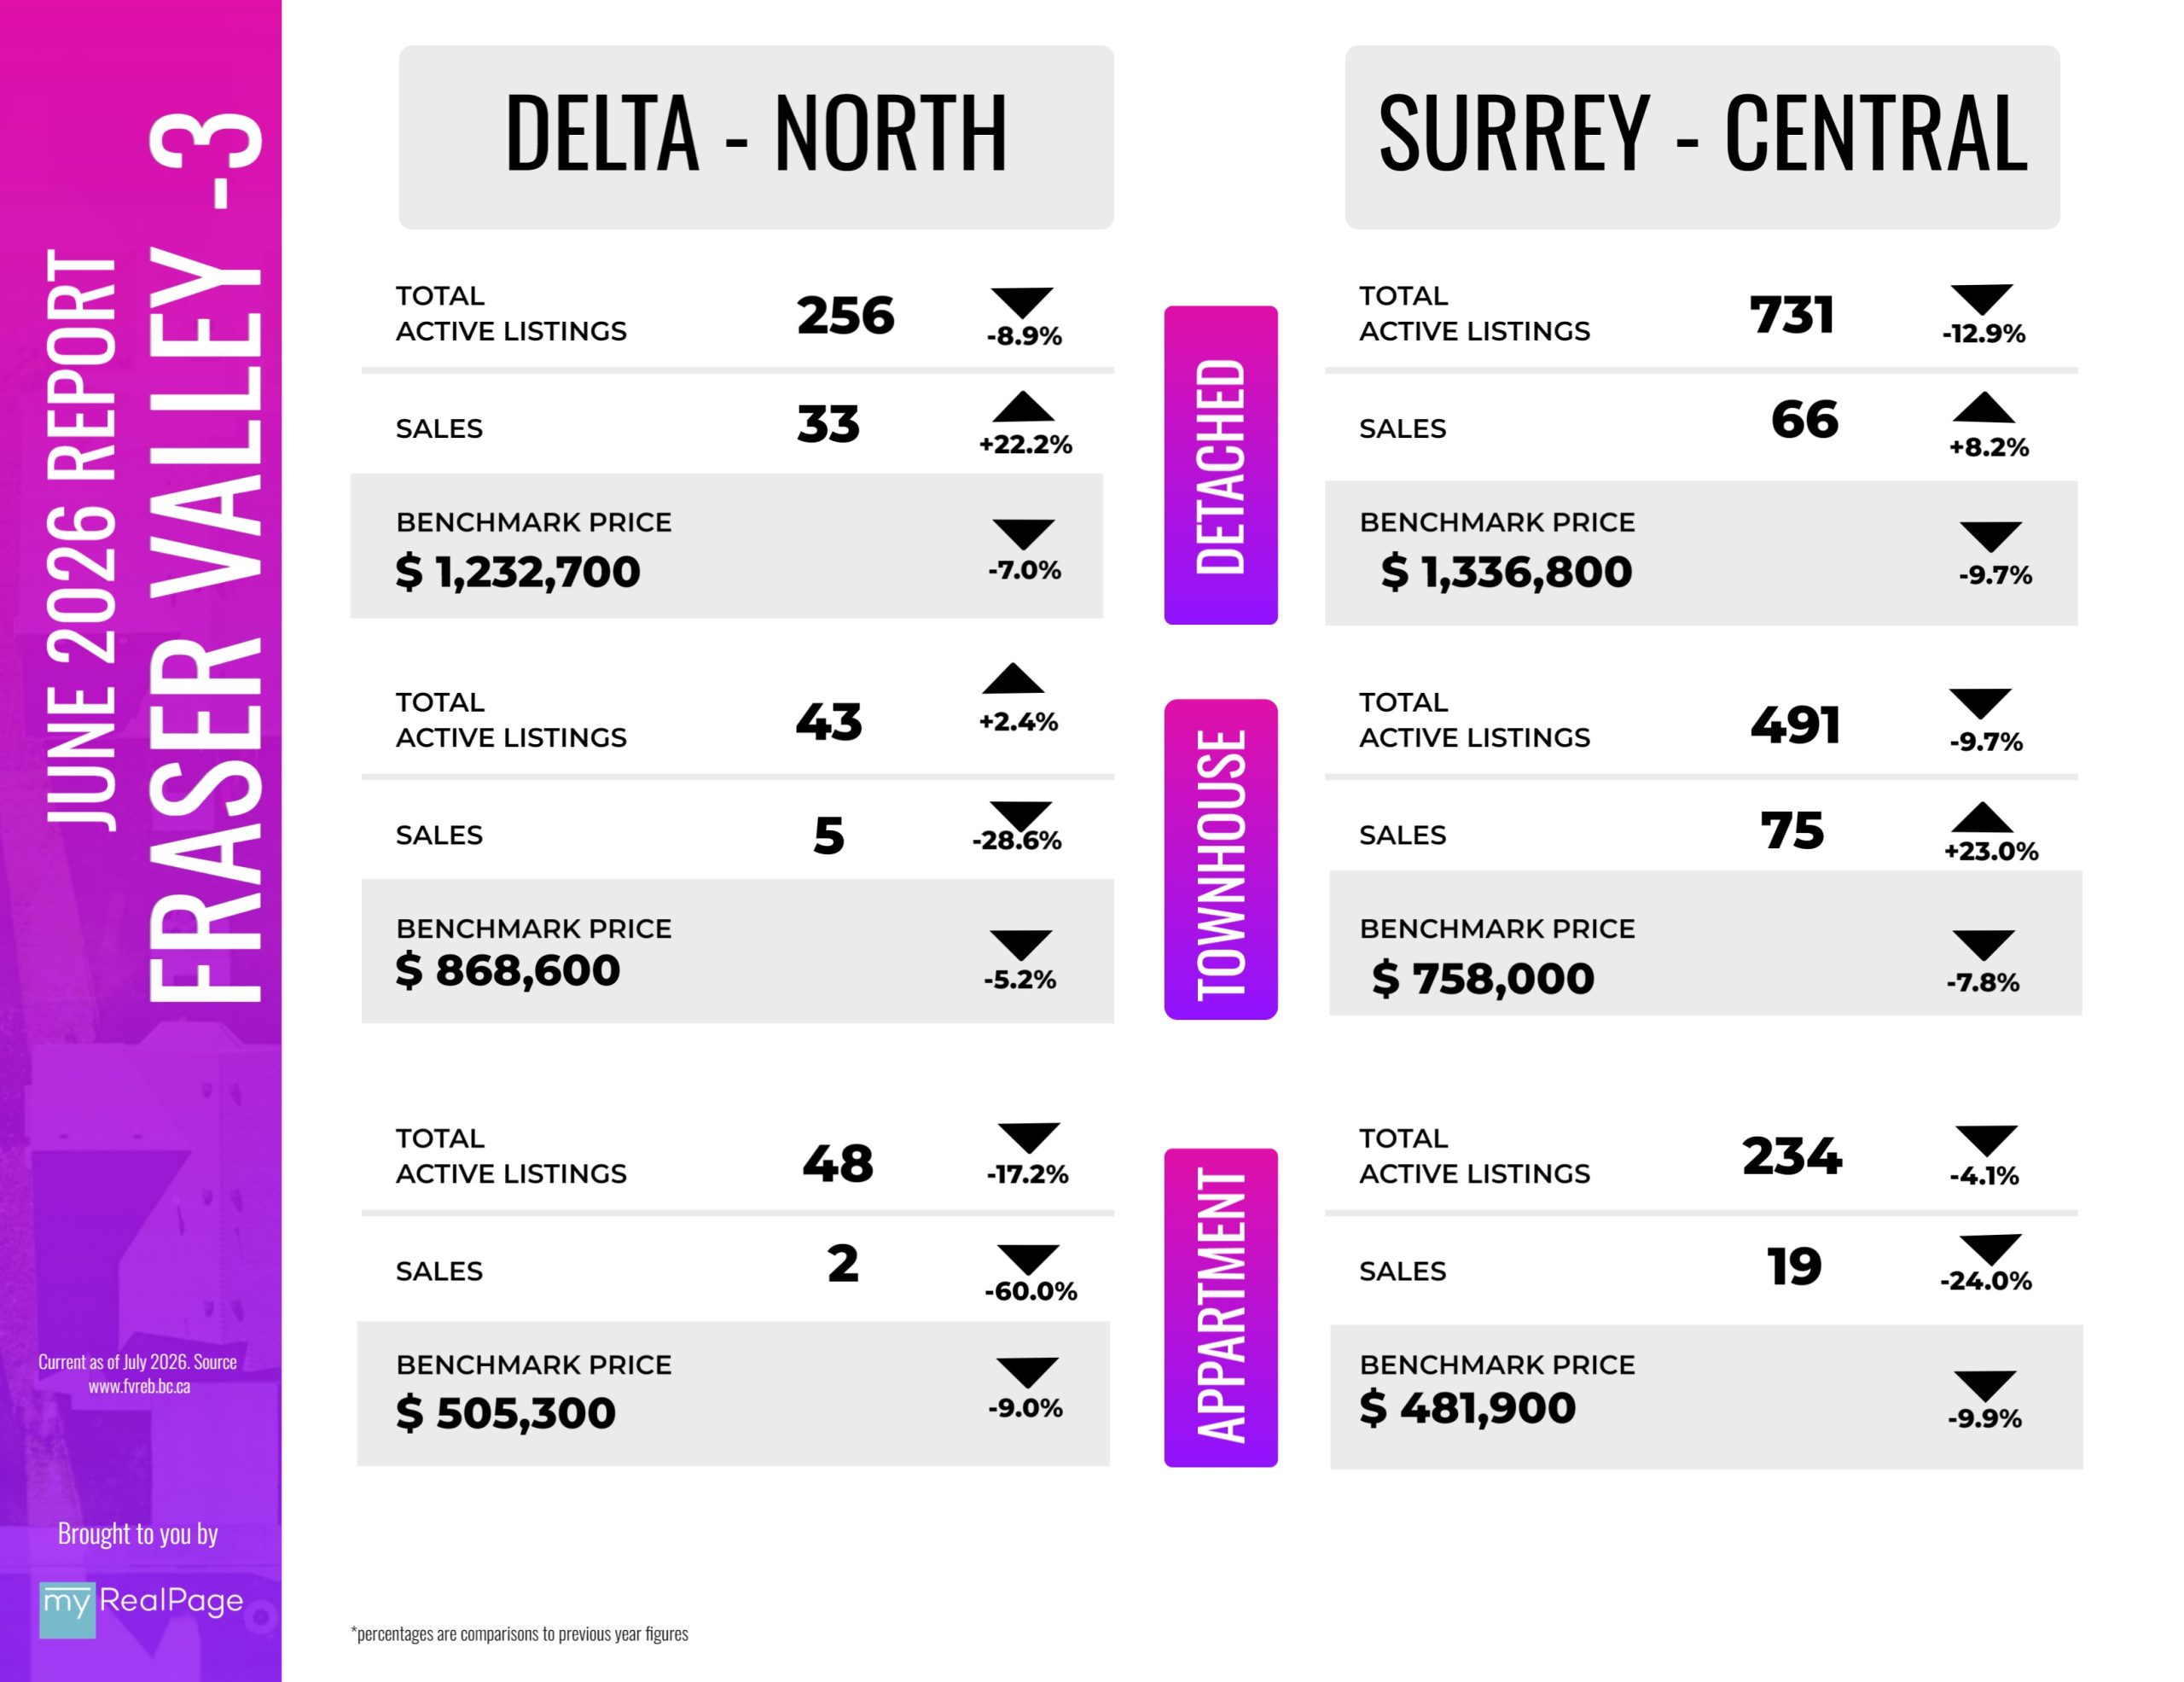
INFOGRAPHICS: June 2026 FVREB Fraser Valley Market Reports
Fraser Valley is becoming more affordable — but buyers are still
holding back
Home prices in the Fraser Valley continued to become more affordable in June, with Benchmark prices now sitting 26 per cent below their 2022 peak. Prices edged down another 0.9 per cent during the month, reinforcing buyer-friendly conditions despite a sluggish market.
The Fraser Valley Real Estate Board recorded 1,147 sales on its Multiple Listing Service® (MLS®) in June, a two per cent increase from May, but four per cent below the same month last year. After pulling back in May, seller activity levelled off in June, with 3,303 new listings—virtually unchanged from May—but still nine per cent below last year’s pace.
“The Fraser Valley spring market has underperformed expectations despite improving affordability and more choice for buyers,” said Ishaq Ismail, Chair of the Fraser Valley Real Estate Board. “Opportunities are clearly there. The question is whether qualified buyers on the sidelines recognize the value available today. For those looking to enter the market or move up, current conditions present a compelling opportunity.”
Read the full report on the FVREB website!
The following data is a comparison between June 2026 and June 2025 numbers, and is current as of July of 2026. For last month’s report, check out our previous infographic!
Or follow this link for all our FVREB Infographics!
These infographics cover current trends in Fraser Valley neighbourhoods that are within the FVREB. Click on the images for a larger view!
Download Printable Version – FVREB June 2026 Market Report


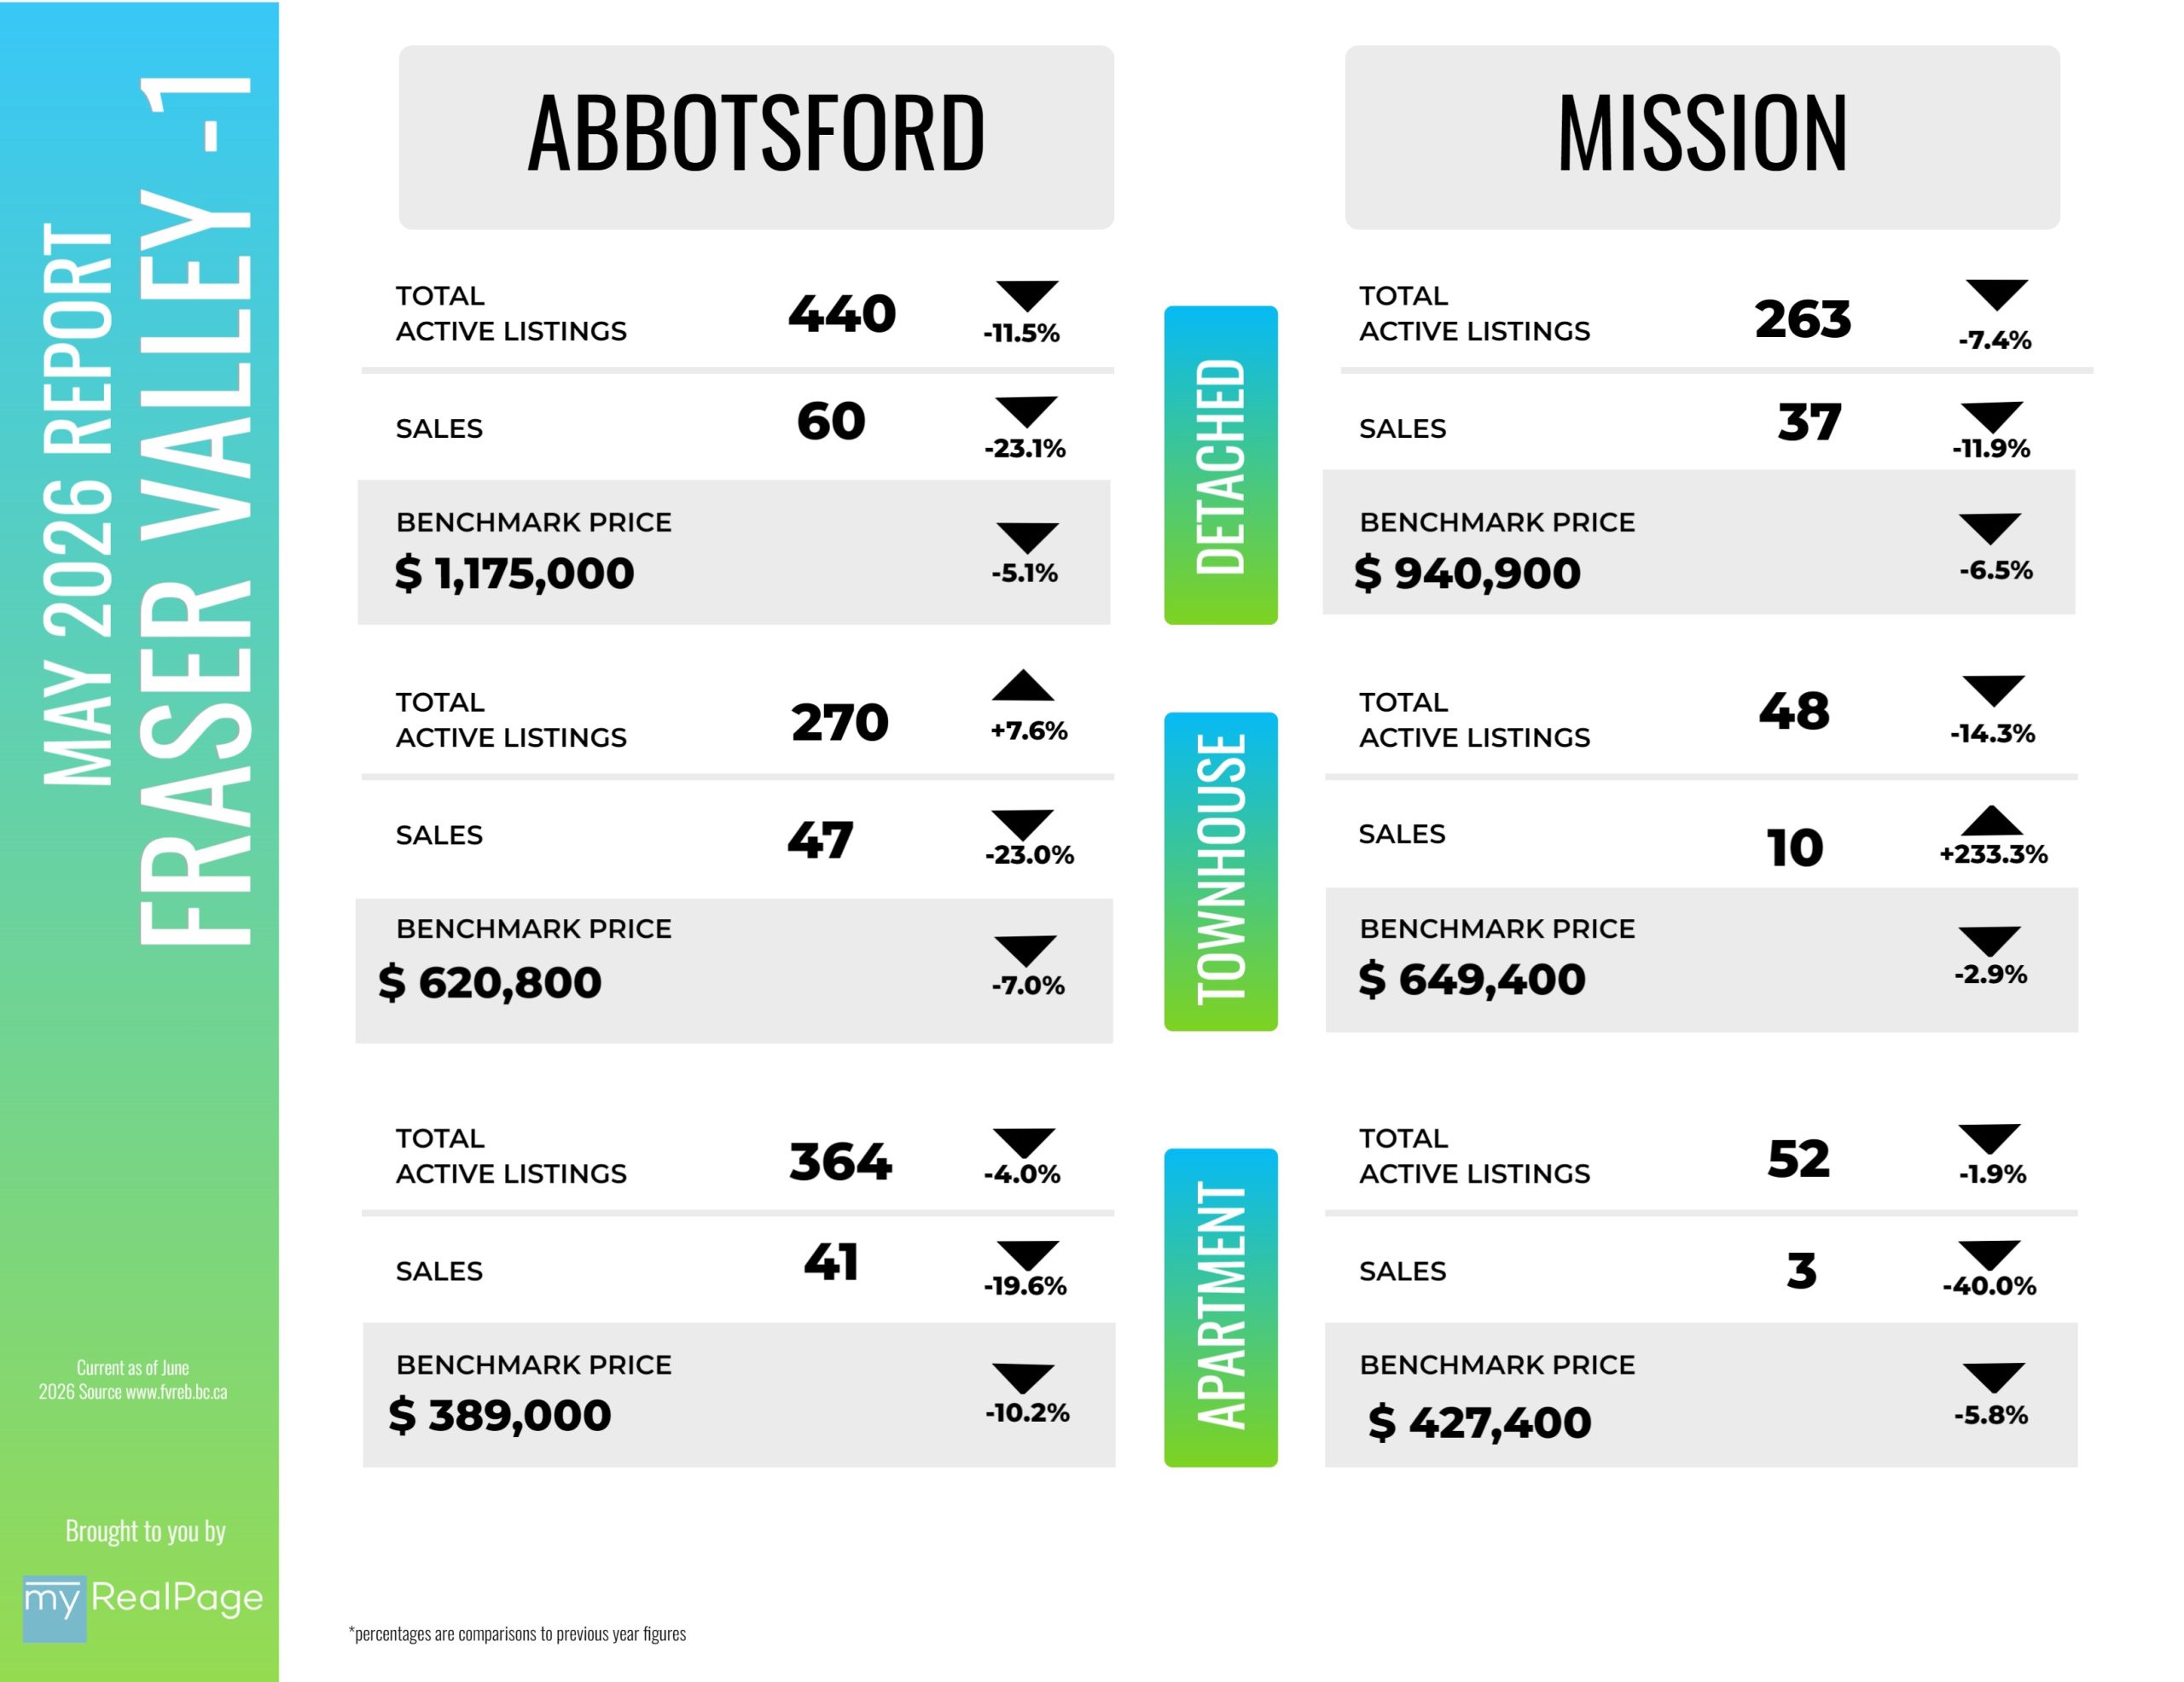
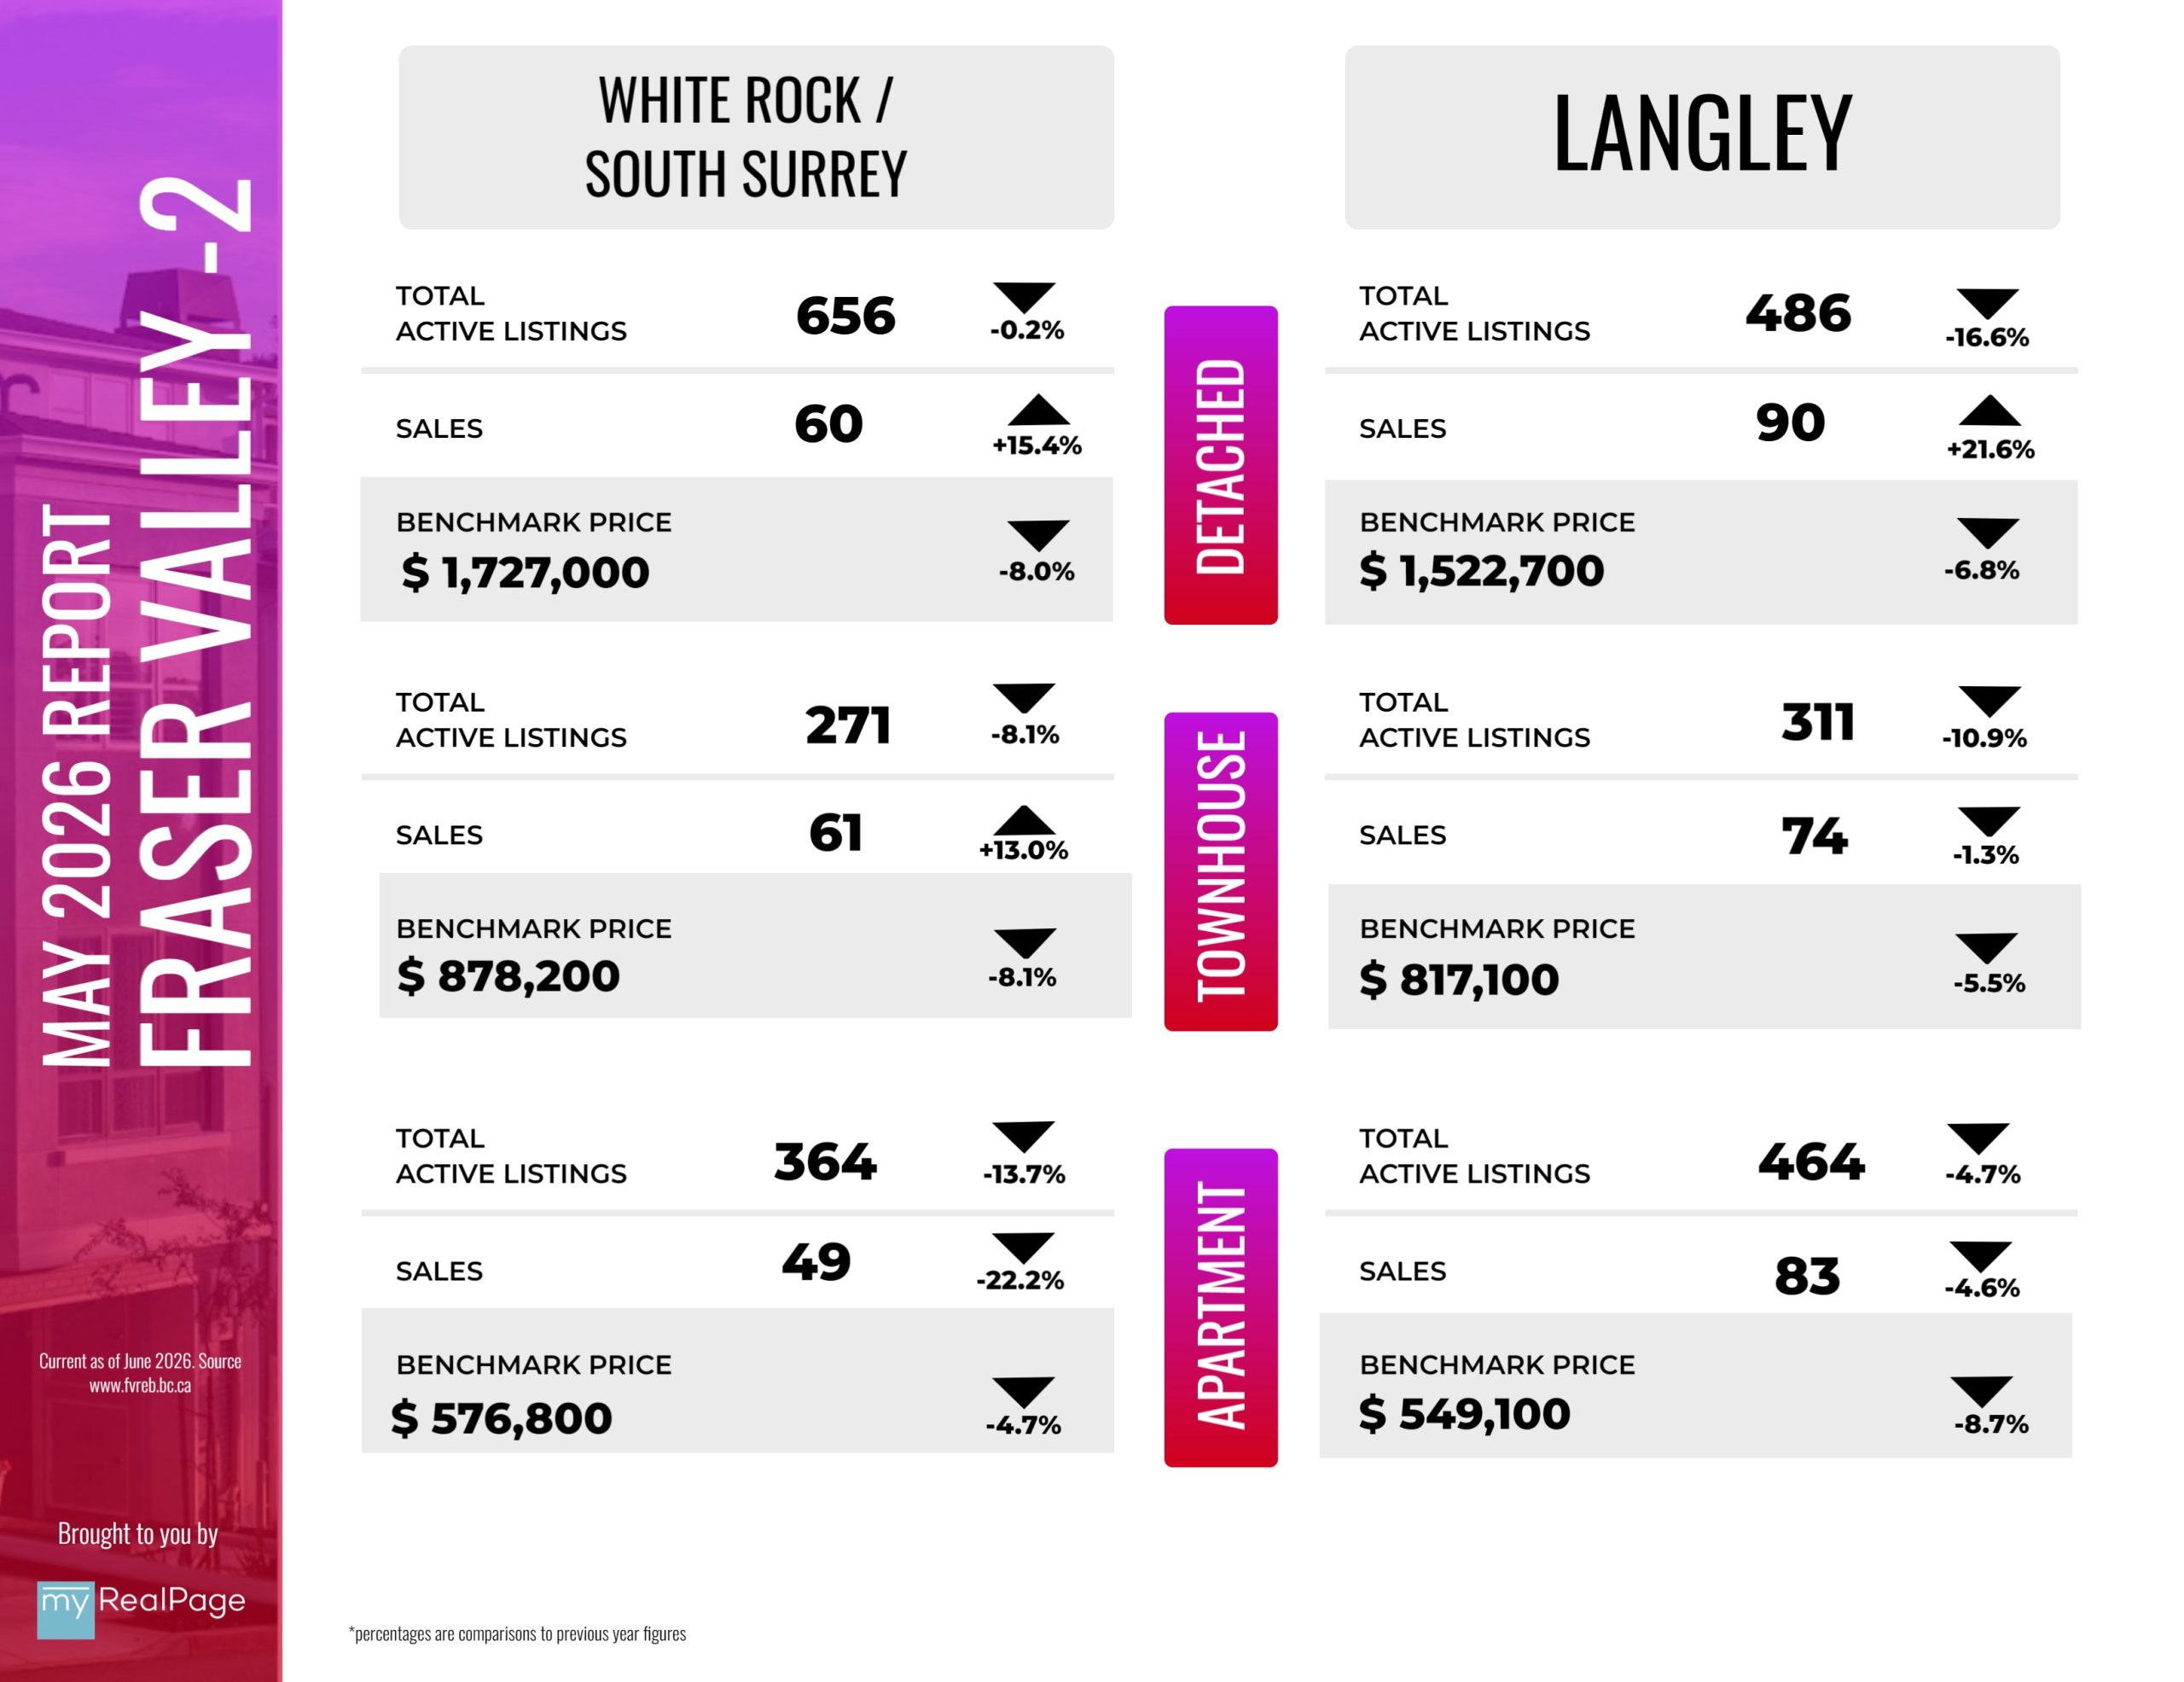
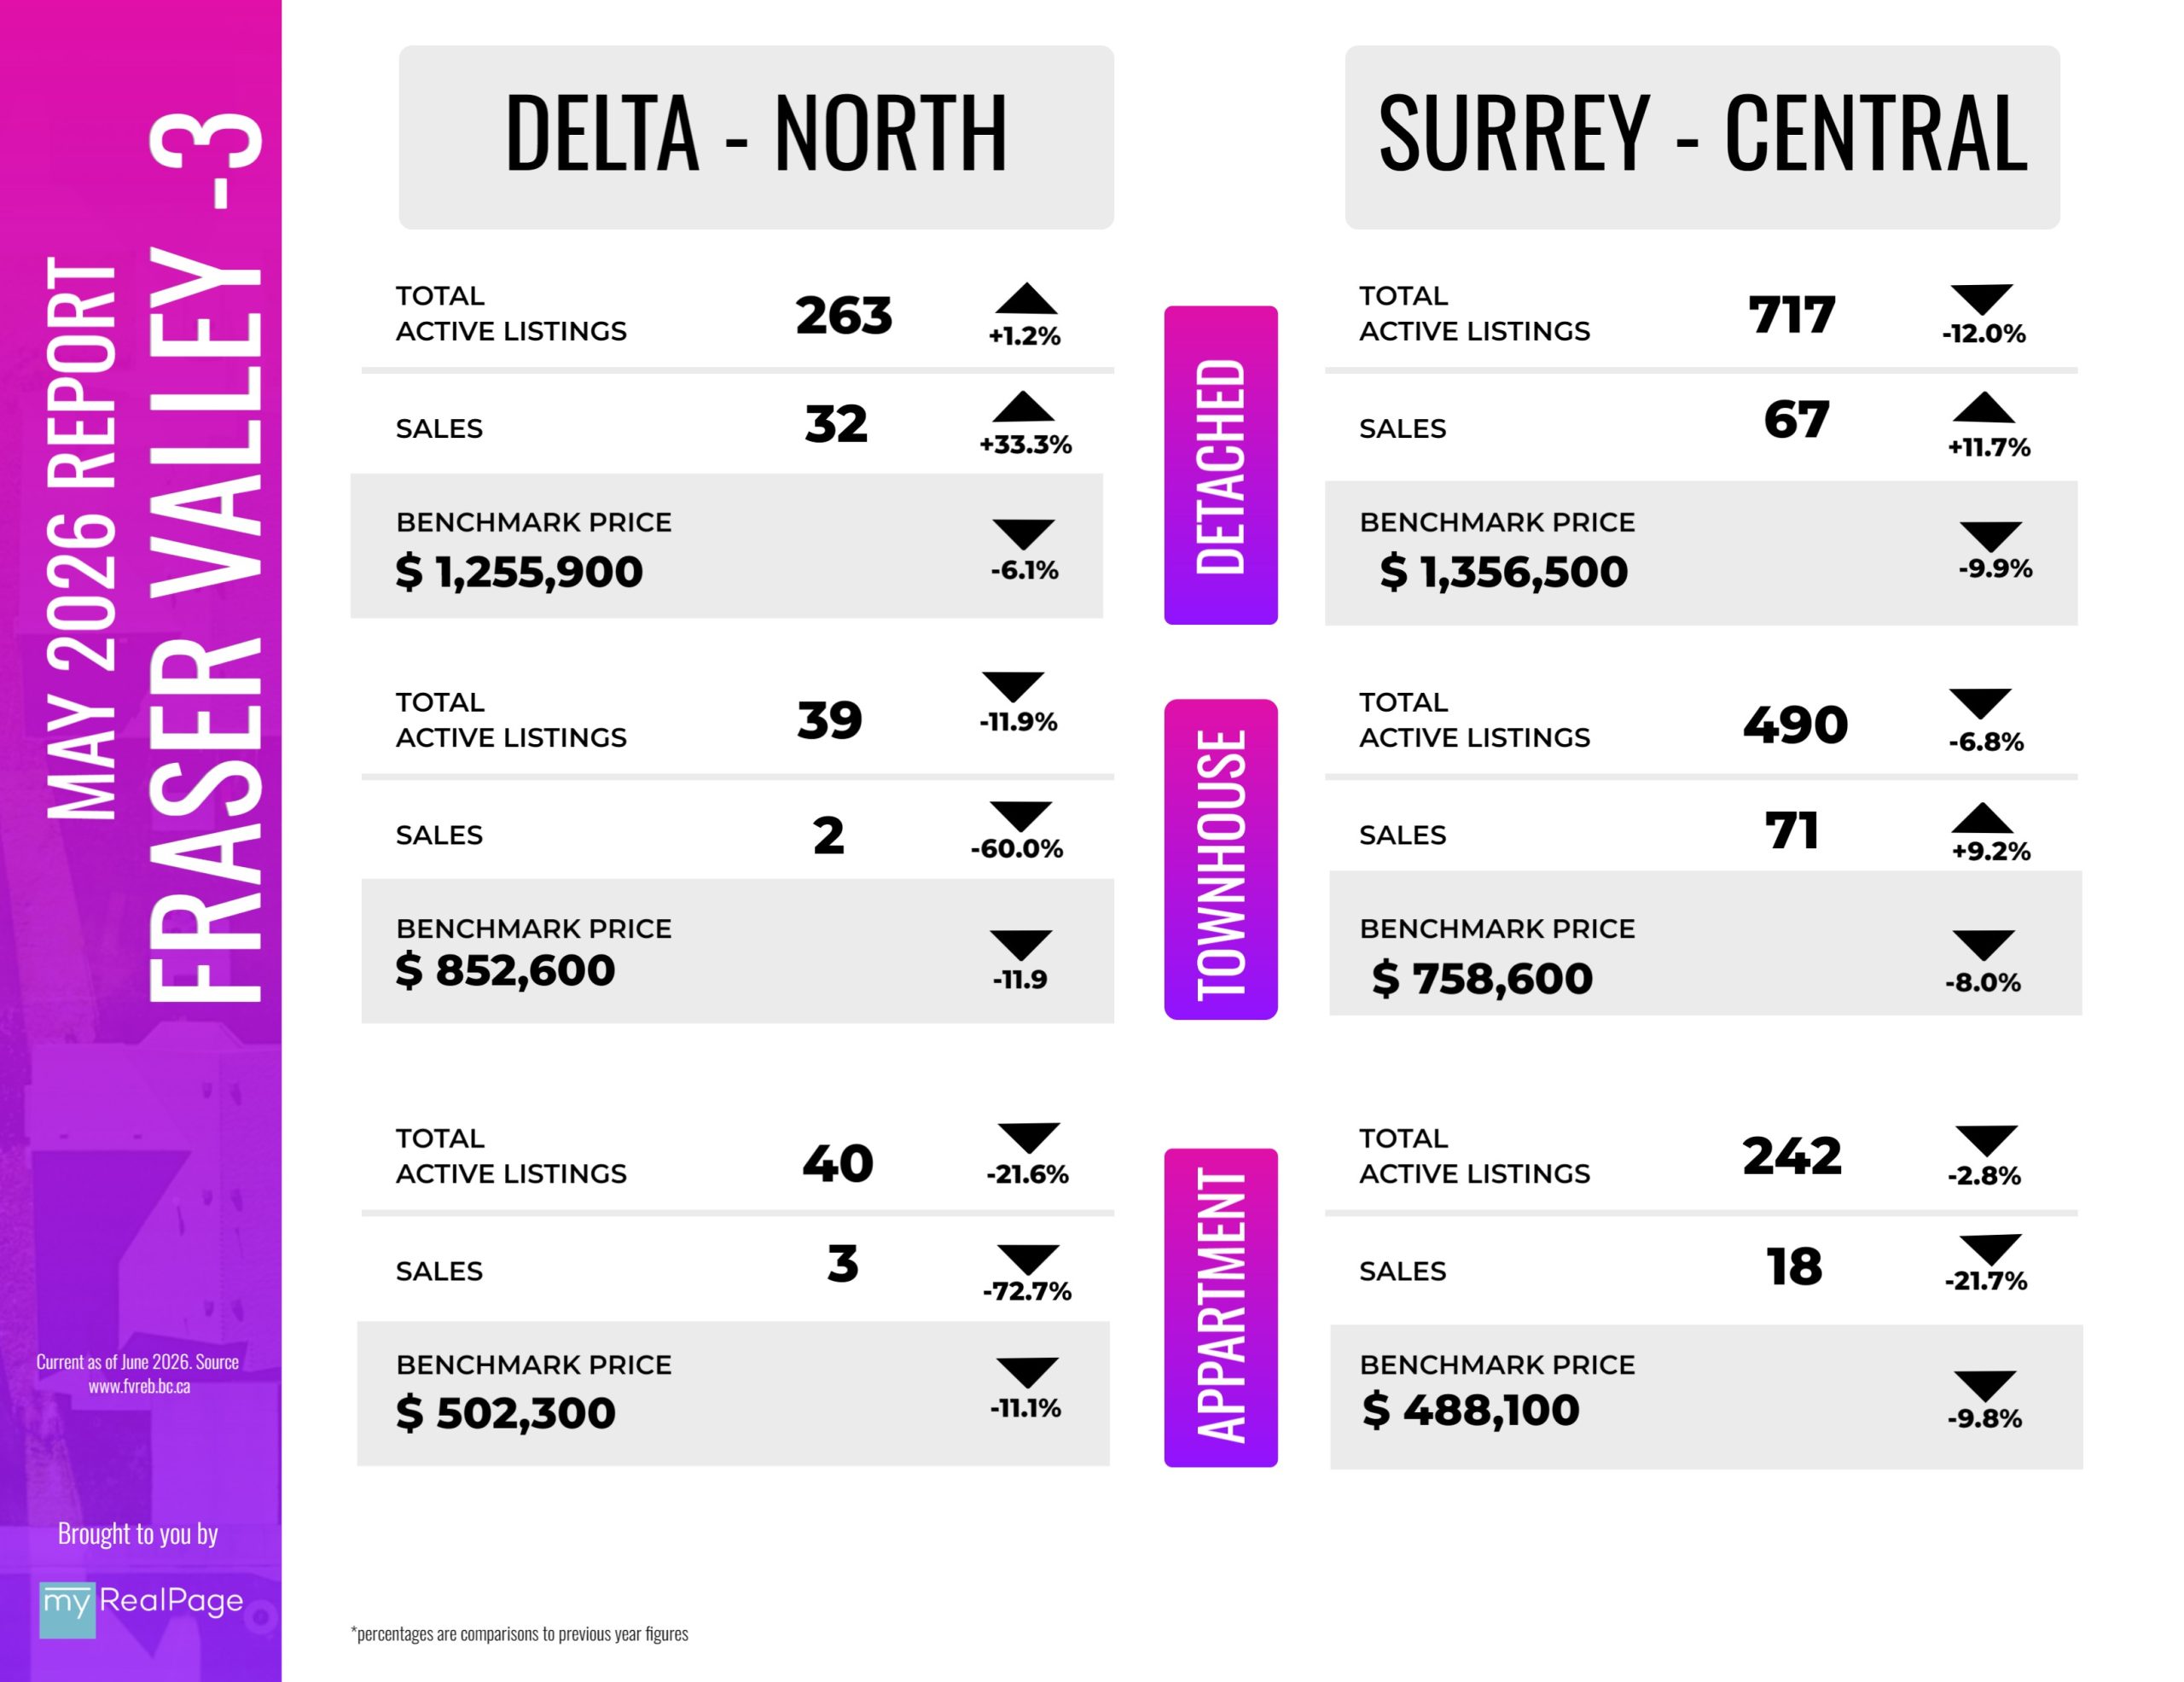
INFOGRAPHICS: May 2026 FVREB Fraser Valley Market Reports
Falling prices open the door for Fraser Valley move-up buyers
A modest increase in Fraser Valley home sales in May suggests buyers remain engaged, albeit cautiously as economic uncertainty continues to temper the pace of the spring market.
The Fraser Valley Real Estate Board recorded 1,124 sales on its Multiple Listing Service® (MLS®) in May, a 0.5 per cent increase from April, but five per cent below the same month last year. Single-family homes remained the most active segment of the Fraser Valley market in May, generating more sales than townhouses and apartments.
“We’re seeing limited activity from first-time buyers right now, with much of the market being driven by homeowners looking to move up,” said Ishaq Ismail, Chair of the Fraser Valley Real Estate Board. “As prices in the detached segment have become more attainable, buyers with existing equity are finding opportunities to transition into larger homes and market segments that were out of reach just a few years ago.
Read the full report on the FVREB website!
The following data is a comparison between May 2026 and May 2025 numbers, and is current as of June of 2026. For last month’s report, check out our previous infographic!
Or follow this link for all our FVREB Infographics!
These infographics cover current trends in Fraser Valley neighbourhoods that are within the FVREB. Click on the images for a larger view!
Download Printable Version – FVREB May 2026 Market Report

INFOGRAPHICS: April 2026 FVREB Fraser Valley Market Reports
Rising sales and price gains hint at stability in the Fraser Valley housing market
For the first time in more than a year, Fraser Valley home sales recorded a year-over-year increase, with activity also rising month-over-month as the spring market begins to show renewed activity. The Fraser Valley Real Estate Board recorded 1,118 sales on its Multiple Listing Service® (MLS®) in April, an 11 per cent increase from March and seven per cent above the same month last year.
Sellers continued to enter the spring market, with new listings rising six per cent from March to 3,549 — still above seasonal norms, but lower than this time last year.
“Market activity is picking up as we move through the spring, but overall conditions remain firmly in buyers’ favour,” said Ishaq Ismail, Chair of the Fraser Valley Real Estate Board. “With inventory at healthy levels and housing affordability improving, buyers continue to have the advantage, although confidence remains tempered by ongoing economic uncertainty and persistent market headwinds.”
Read the full report on the FVREB website!
The following data is a comparison between April 2026 and April 2025 numbers, and is current as of May of 2026. For last month’s report, check out our previous infographic!
Or follow this link for all our FVREB Infographics!
These infographics cover current trends in Fraser Valley neighbourhoods that are within the FVREB. Click on the images for a larger view!
Download Printable Version – FVREB April 2026 Market Report


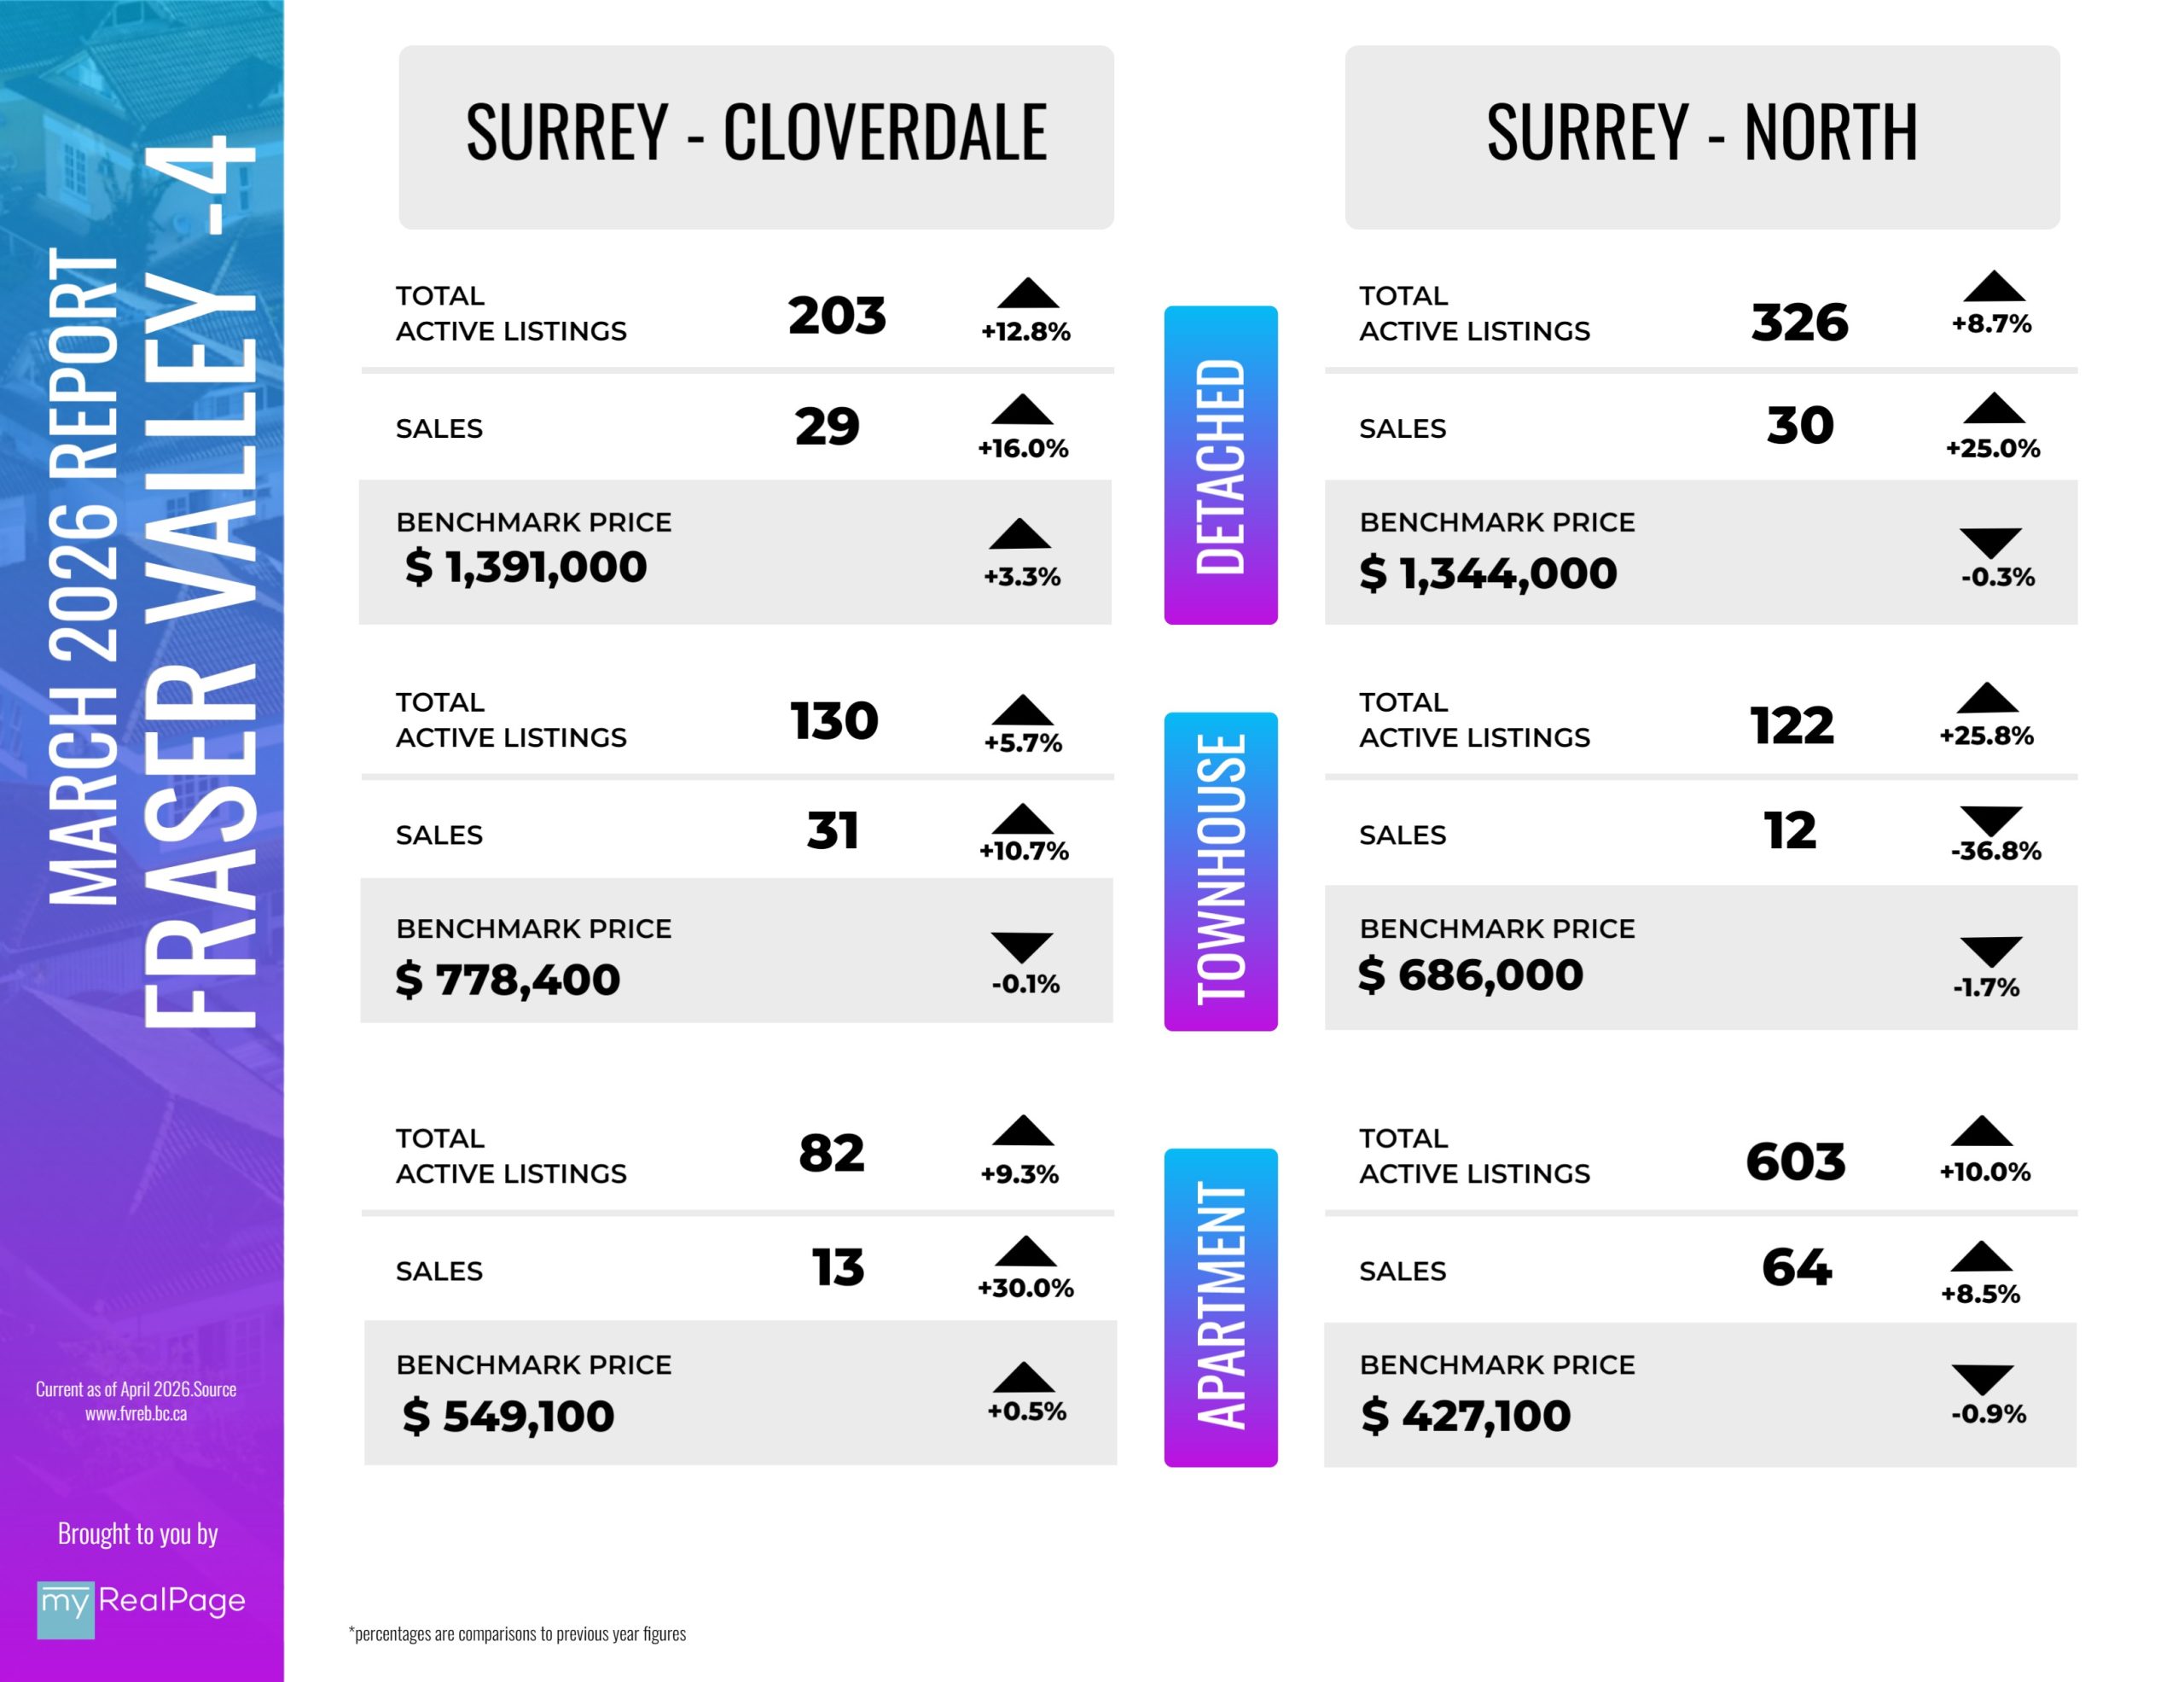
INFOGRAPHICS: March 2026 FVREB Fraser Valley Market Reports
Fraser Valley home prices level off amid improving affordability
After nearly a year of steady price declines, the Fraser Valley housing market is beginning to
show early signs of stabilizing, with Benchmark prices edging up month-over-month for the first time in 11 months. While March sales activity picked up over the previous month, year-over-year sales throughout the first quarter of 2026 continue to stumble, reflecting a market where buyer caution still lingers.
The Fraser Valley Real Estate Board recorded 1,007 sales on its Multiple Listing Service® (MLS®) in March, a 20 per cent increase from February, but three per cent below the same month last year and 42 per cent below the ten-year seasonal average. After a decline in February, new listings increased in March, up 20 per cent to 3,341, suggesting some sellers are eager to get ahead of the spring market despite sales activity remaining soft and well below typical seasonal levels.
“We’re encouraged to see early signs of prices levelling off in the Fraser Valley,” said Ishaq Ismail, Chair of the Fraser Valley Real Estate Board. “While sales remain below last year’s levels, this market is presenting a rare window — with greater choice, improved affordability, and meaningful incentives, particularly in the condo segment — for buyers who are ready to make a move with the right professional guidance.”
Read the full report on the FVREB website!
The following data is a comparison between March 2026 and March 2025 numbers, and is current as of April of 2026. For last month’s report, check out our previous infographic!
Or follow this link for all our FVREB Infographics!
These infographics cover current trends in Fraser Valley neighbourhoods that are within the FVREB. Click on the images for a larger view!
Download Printable Version – FVREB March 2026 Market Report


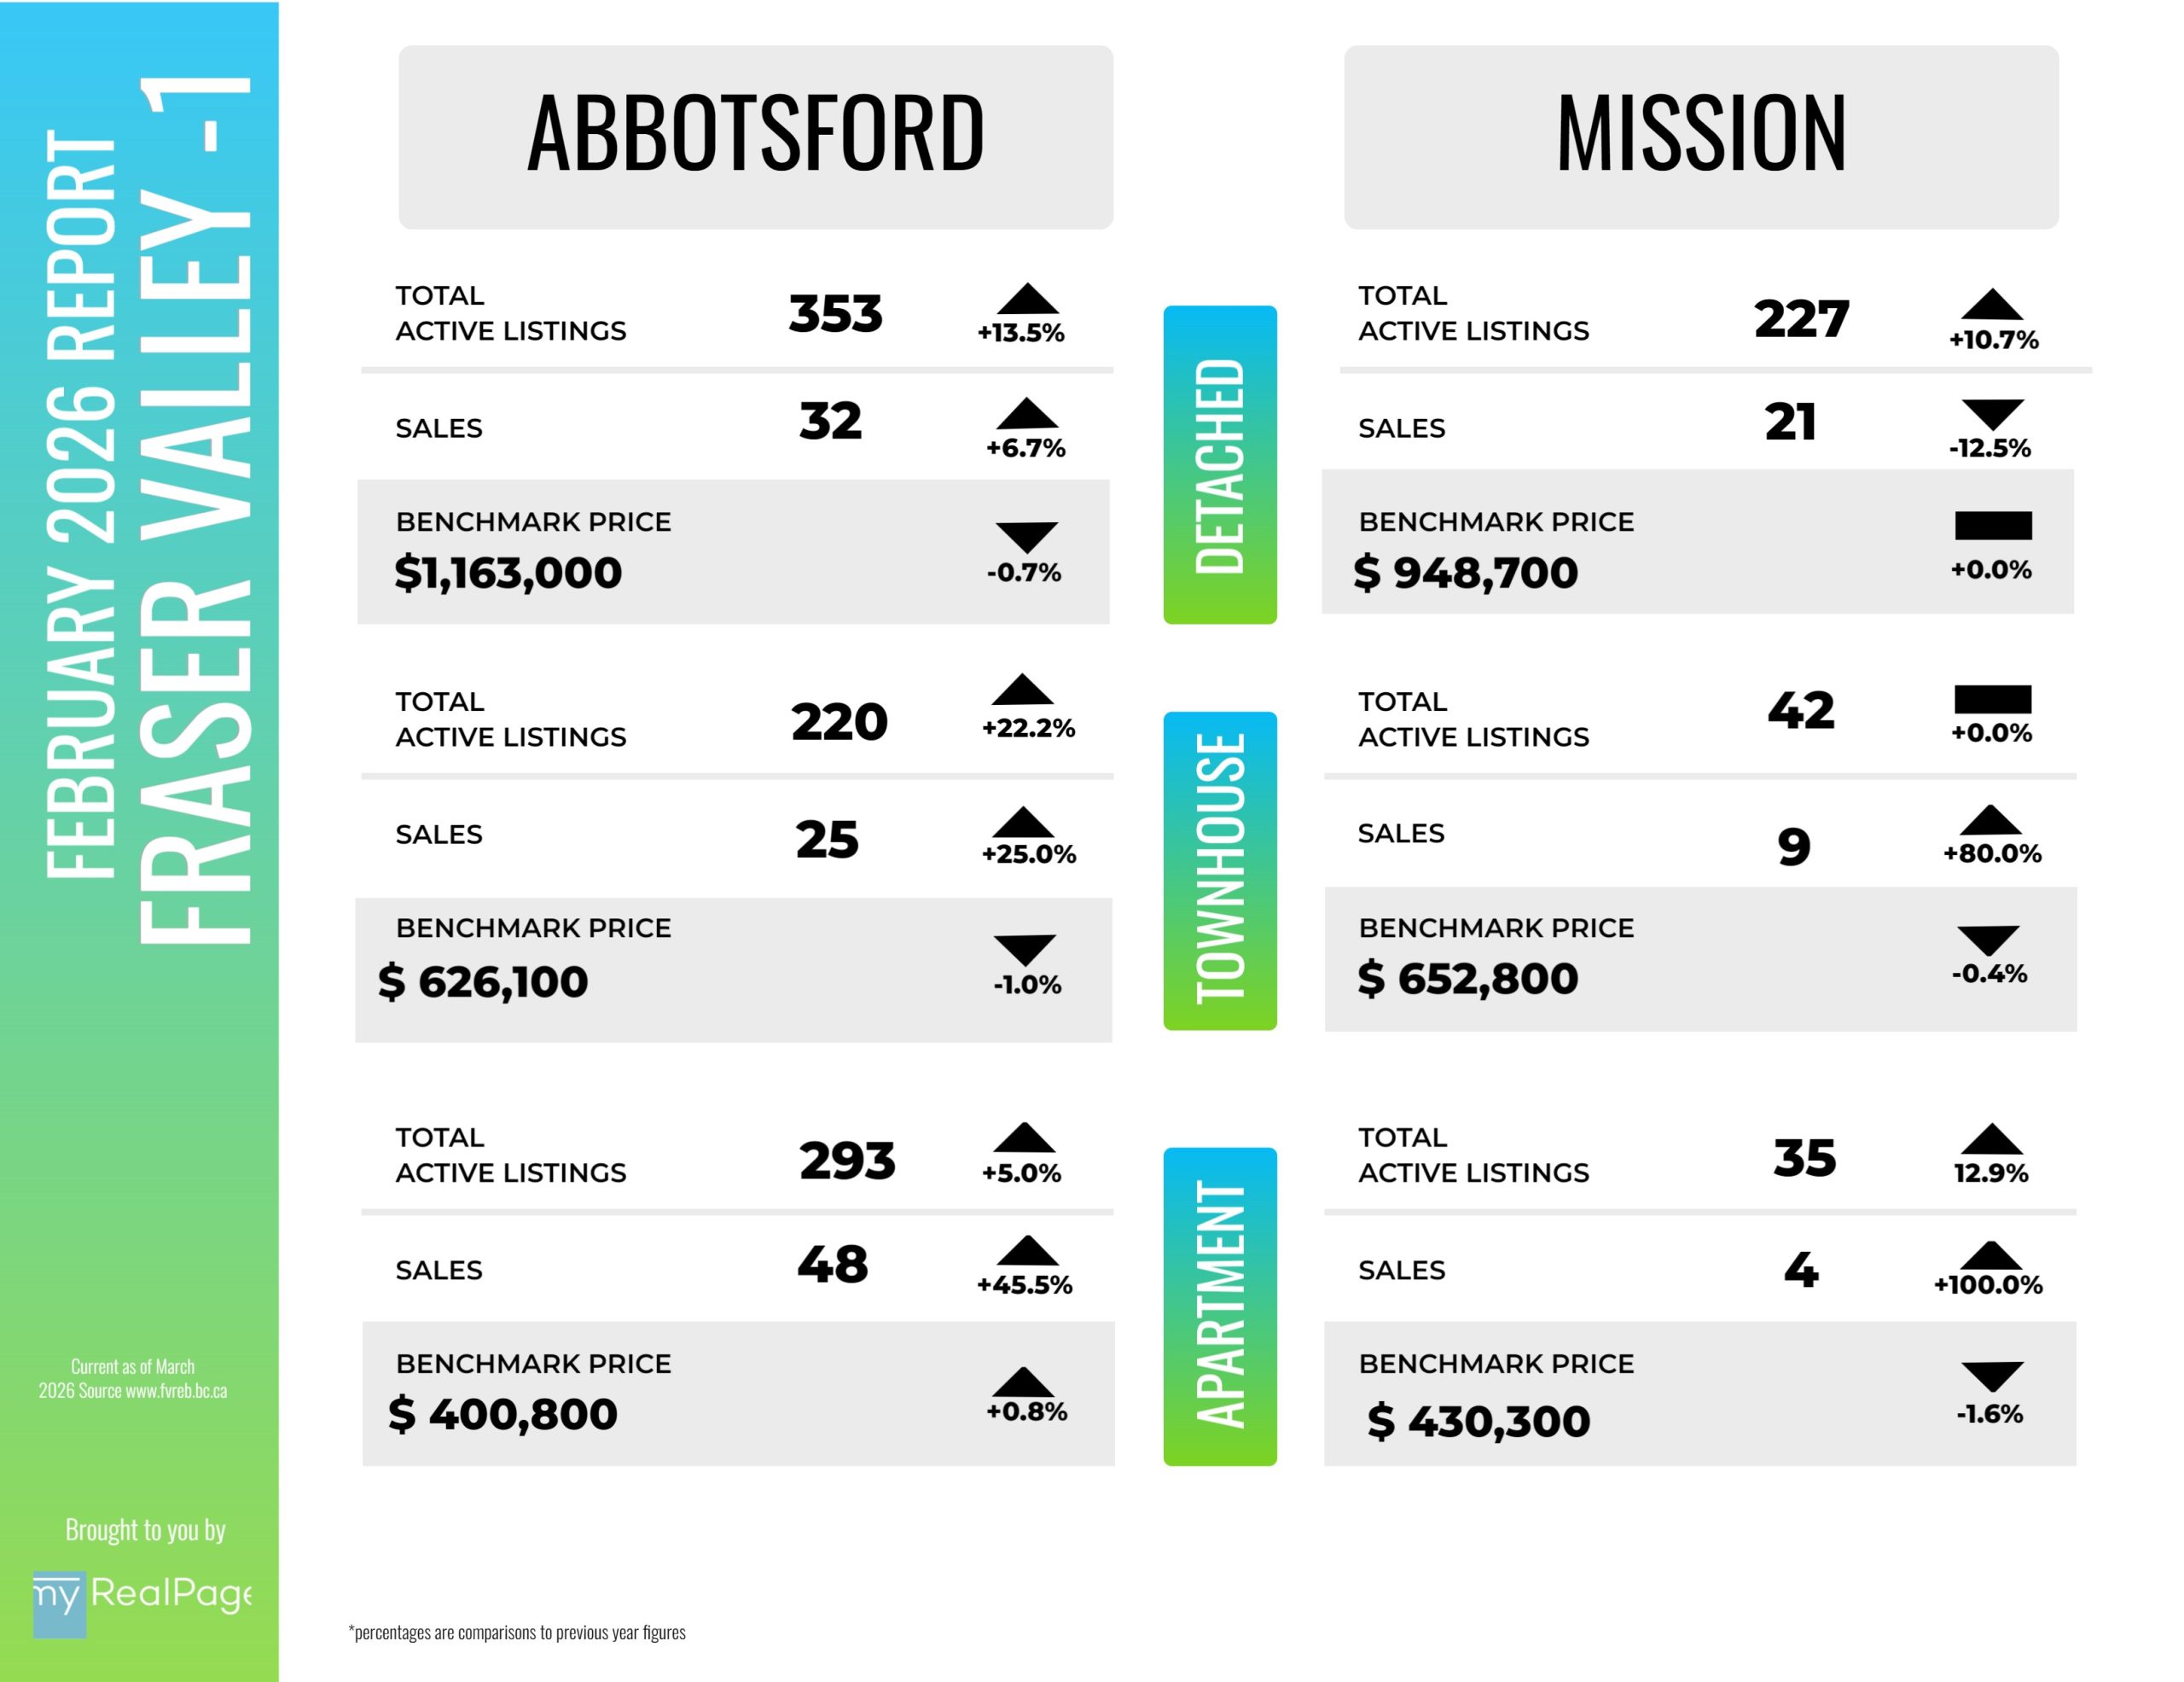
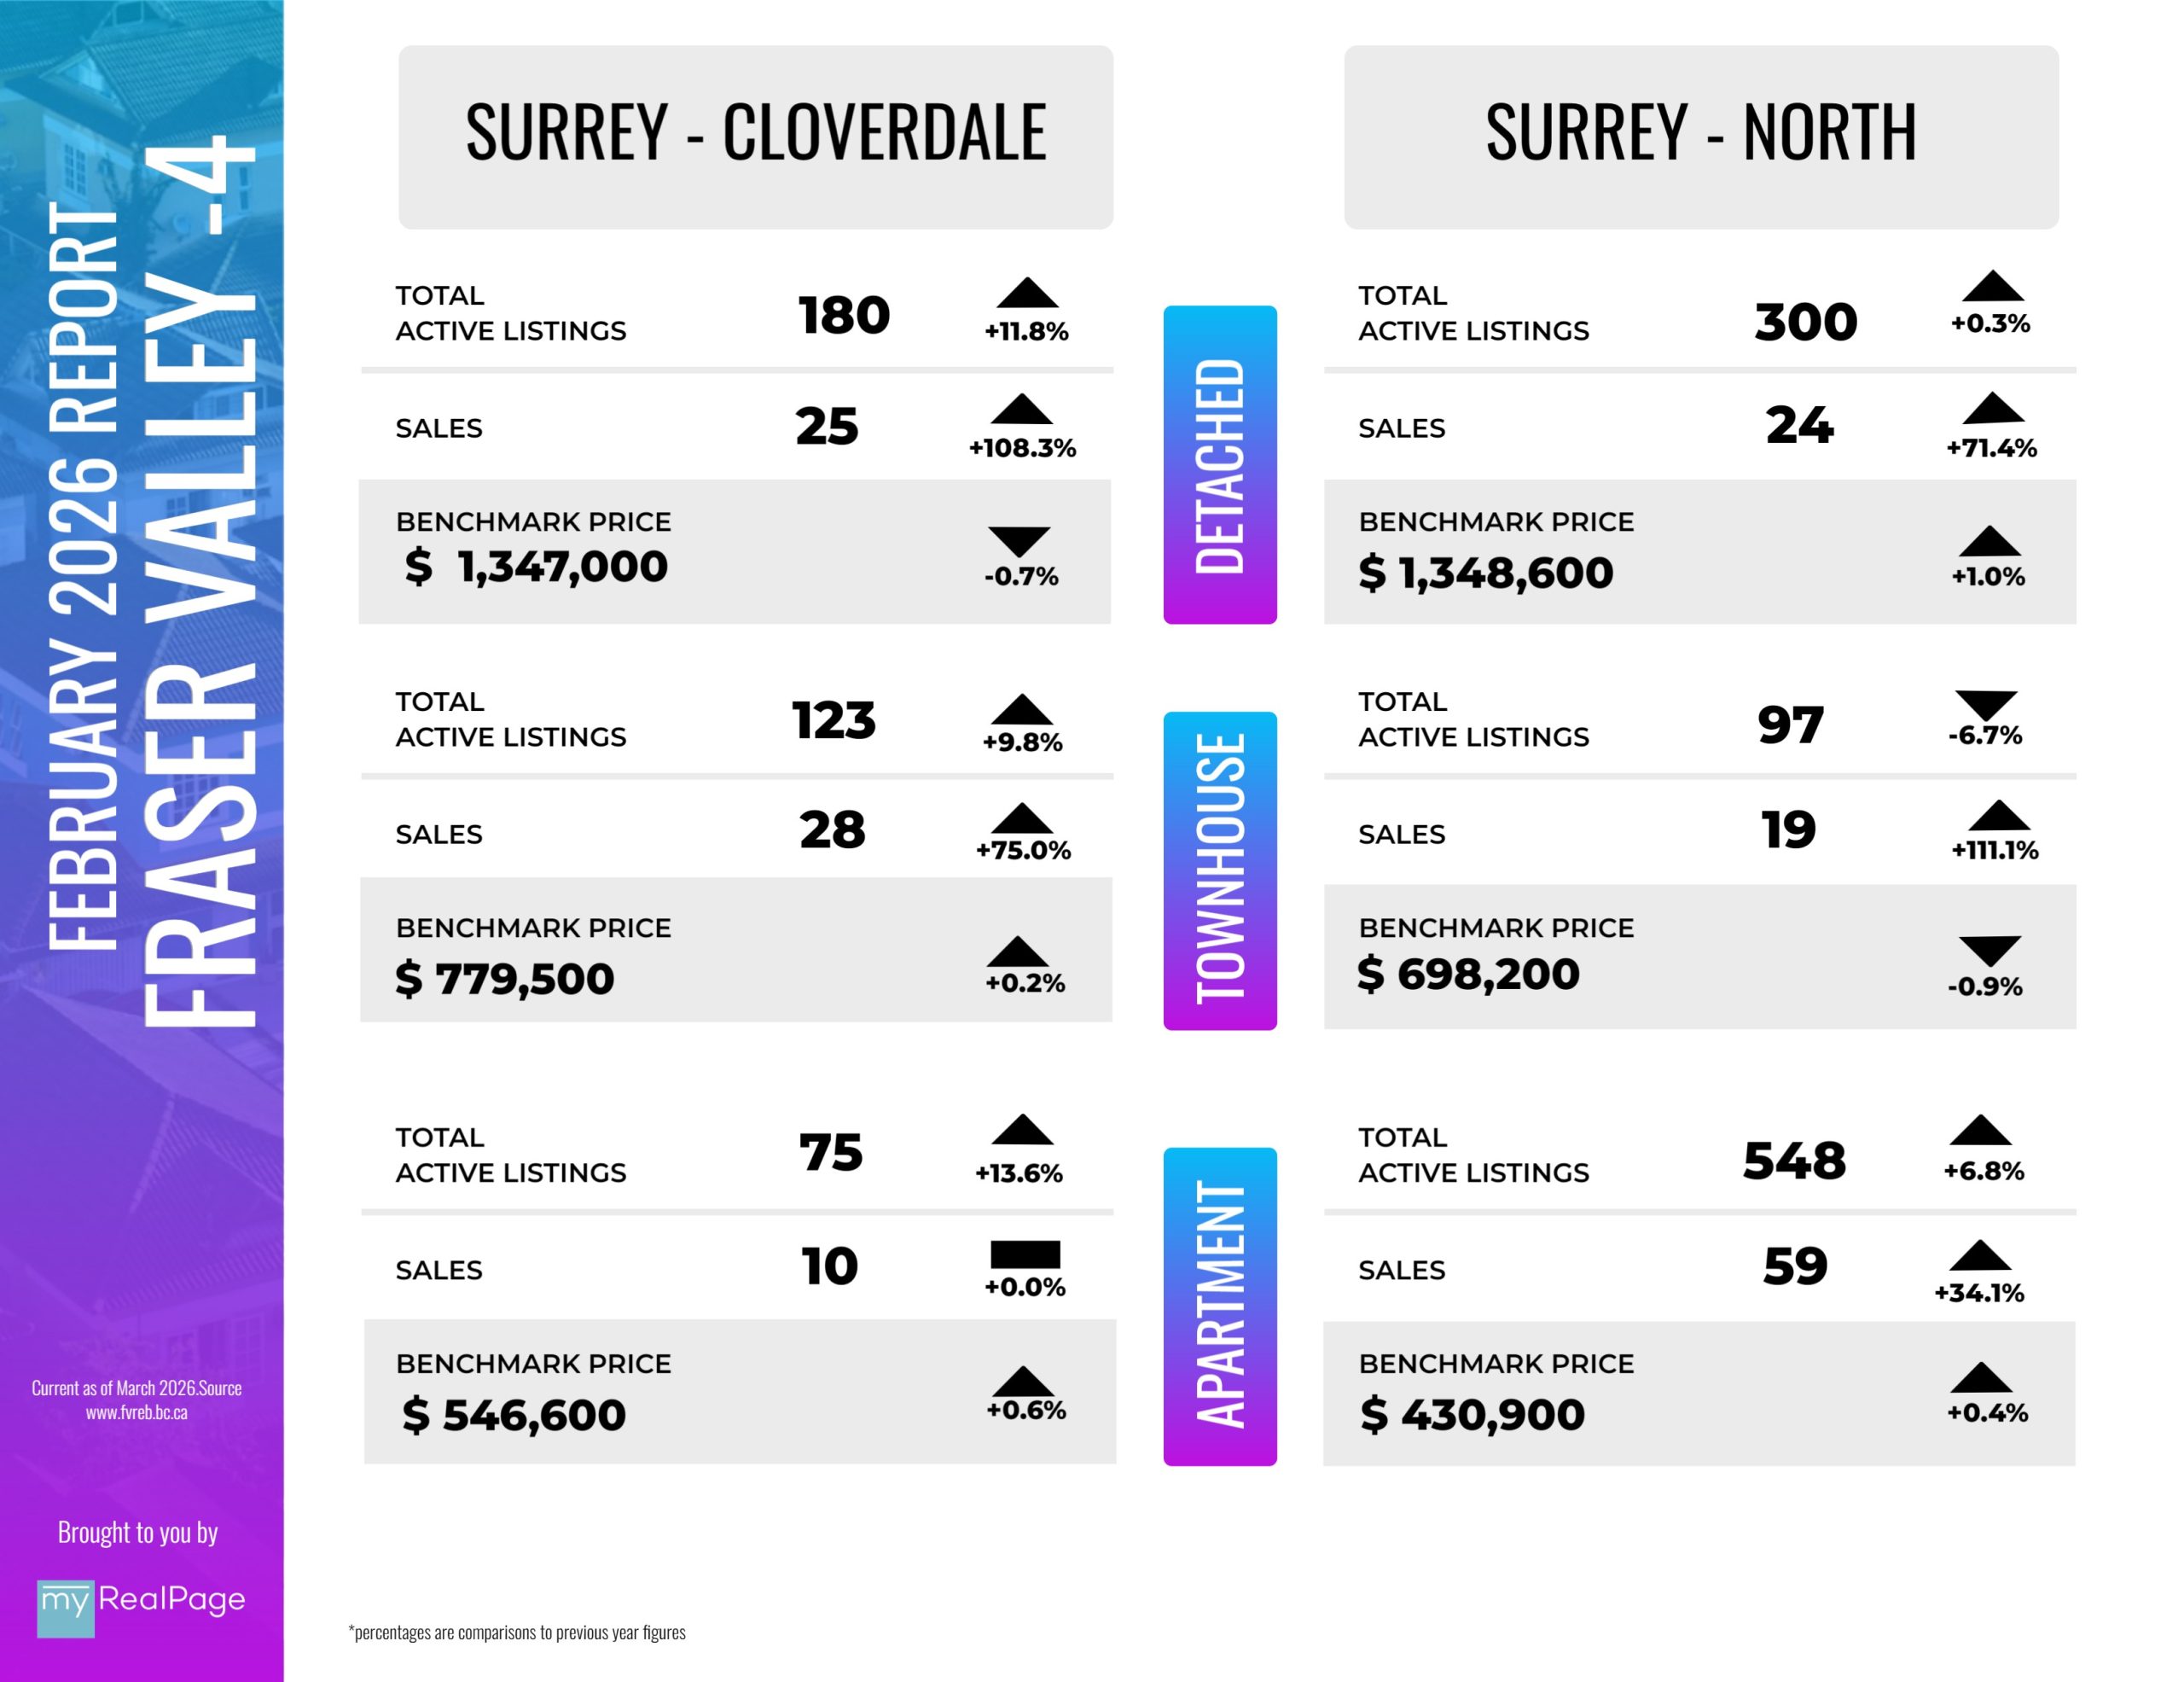
INFOGRAPHICS: February 2026 FVREB Fraser Valley Market Reports
Fraser Valley market shows early bloom with February sales lift
The Fraser Valley market showed early signs of a spring thaw in February, with sales increasing over January, but continuing to trail typical levels for this time of year.
The Fraser Valley Real Estate Board recorded 843 sales on its Multiple Listing Service® (MLS®) in February, a 36 per cent increase from January, but 38 per cent below the ten-year seasonal average. New listings declined nine per cent in February to 2,796, suggesting some sellers are choosing to wait amid competitive inventory levels, and may be positioning their homes for the peak of the spring market.
“Buyer-friendly conditions continue to define the Fraser Valley market,” said Tore Jacobsen, Chair of the
Fraser Valley Real Estate Board. “While we did see a welcome bump in sales over January, they remain well below seasonal averages. With ample inventory and soft prices, this window may prove to be a key buying opportunity, particularly as prices settle. As we move closer to spring, we’re hopeful that improved economic stability will encourage more buyers to re-enter the market.”
Read the full report on the FVREB website!
The following data is a comparison between February 2026 and February 2025 numbers, and is current as of March of 2026. For last month’s report, check out our previous infographic!
Or follow this link for all our FVREB Infographics!
These infographics cover current trends in Fraser Valley neighbourhoods that are within the FVREB. Click on the images for a larger view!
Download Printable Version – FVREB February 2026 Market Report


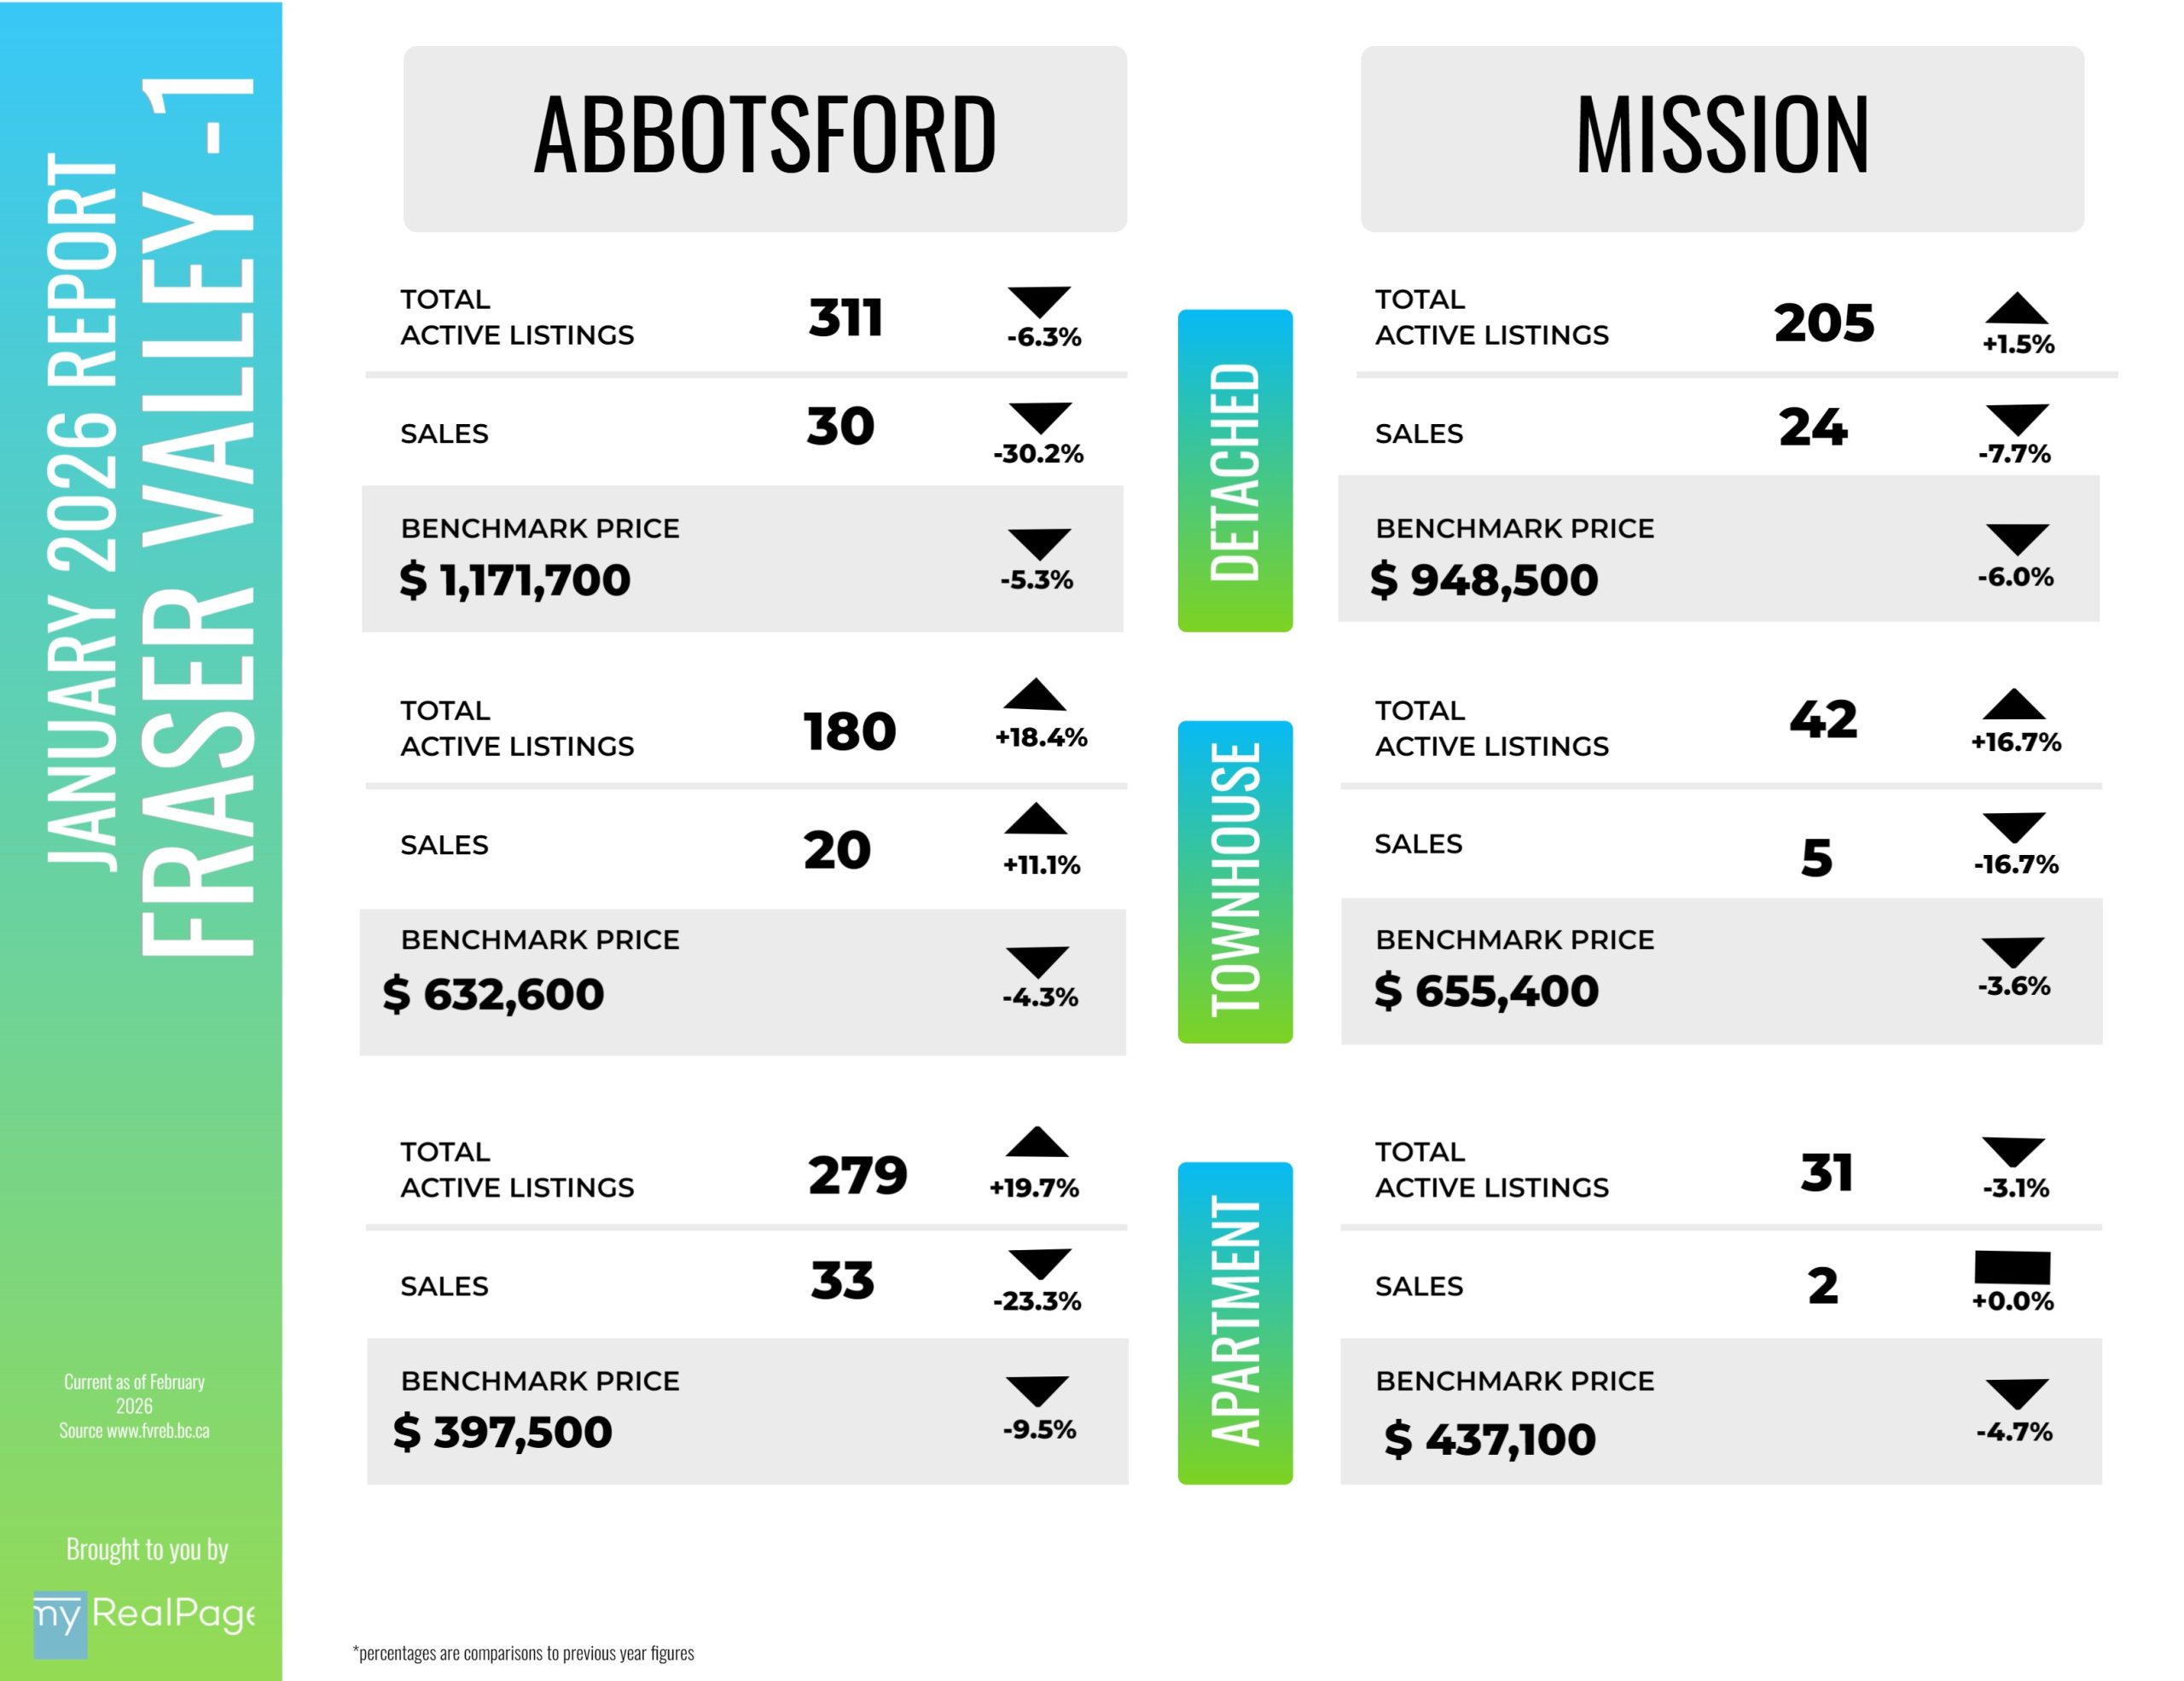
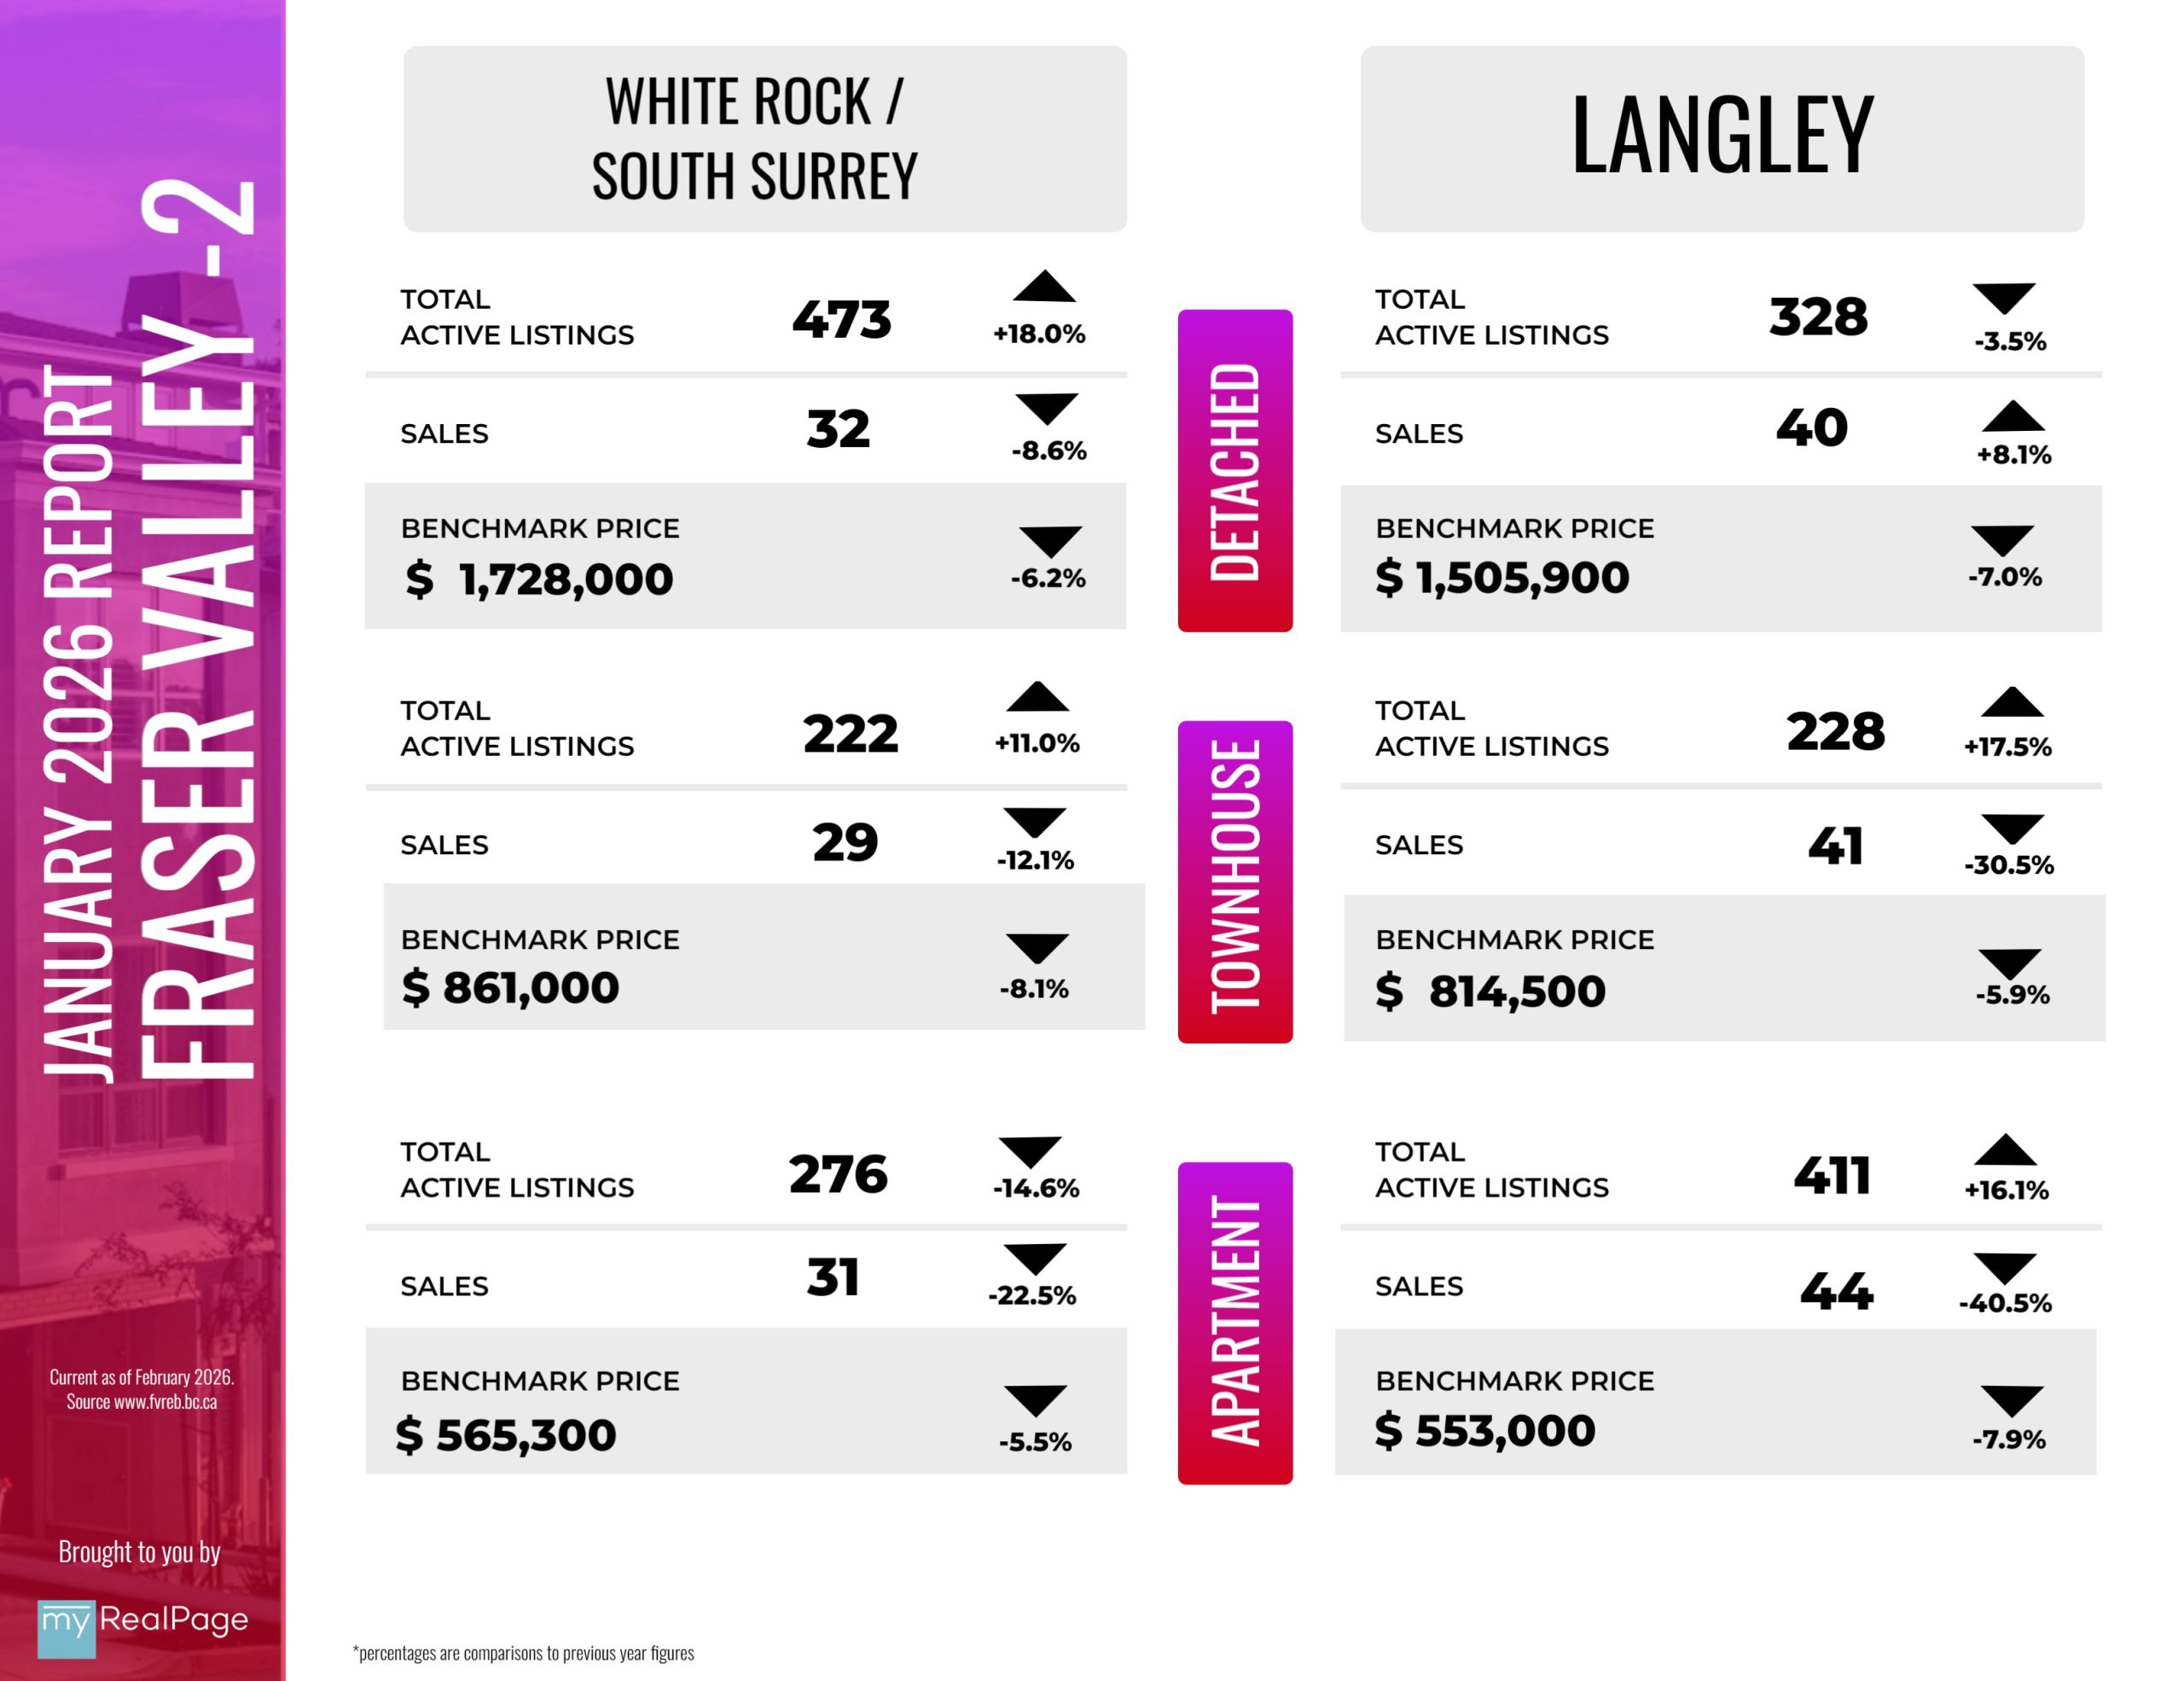
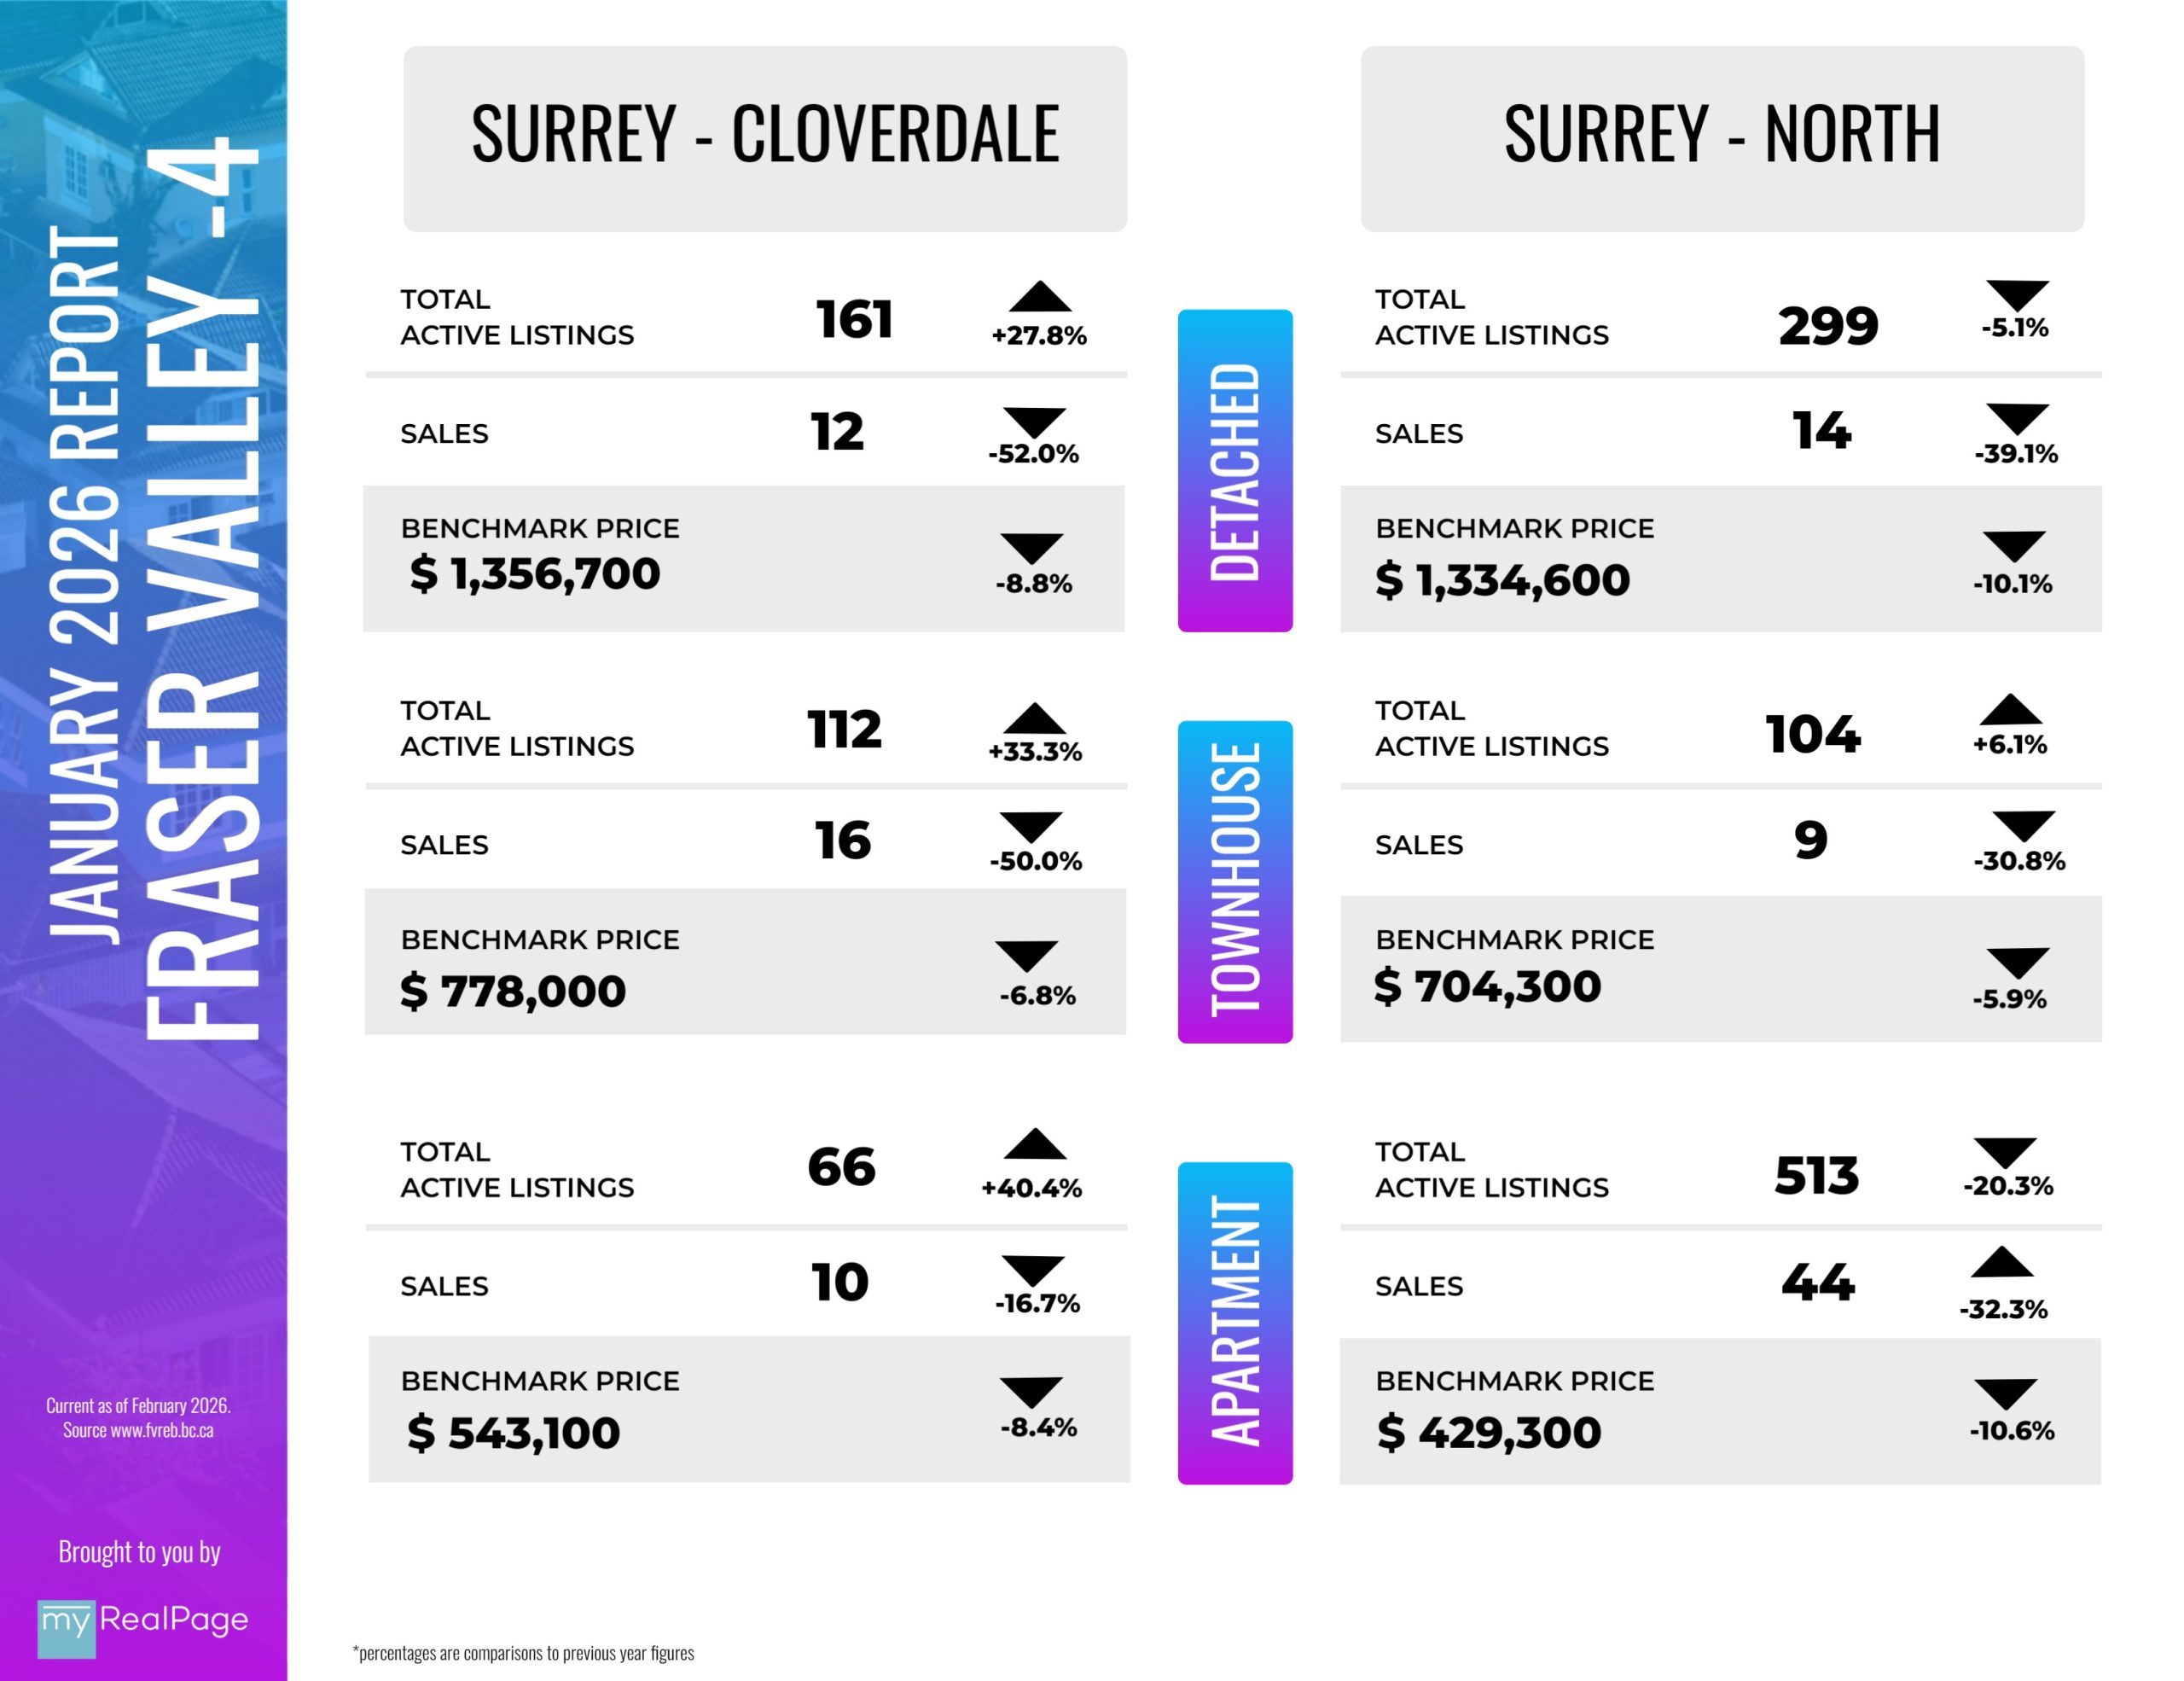
INFOGRAPHICS: January 2026 FVREB Fraser Valley Market Reports
Fraser Valley home prices back to pandemic-era levels under weight of economic headwinds and sustained inventory
Home prices in the Fraser Valley fell for the tenth consecutive month in January, pushing the Benchmark price below $900,000 for the first time since spring 2021.
The Benchmark price for a typical home in the Fraser Valley dropped one per cent in January to $897,200, down 6.9 per cent year-over-year. The continued softening of prices wasn’t enough to get buyers off the sidelines, as the Fraser Valley Real Estate Board recorded 619 sales on its Multiple Listing Service® (MLS®) in January, a 33 per cent decrease from December, and 24 per cent below sales from the same month last year. New listings increased 128 per cent in January to 3,078, reflecting the typical seasonal patterns; however, activity remained 10 per cent below last year’s levels.
“January opened the year with negligible momentum,” said Tore Jacobsen, Chair of the Fraser Valley Real Estate Board. “Prices continued to weaken while at the same time selection remains high. Under normal market dynamics, these would be considered highly favourable conditions for buyers, however the uncertainty of the past year or so continues to loom large, subduing buyer confidence and muting overall market activity.”
Read the full report on the FVREB website!
The following data is a comparison between January 2026 and January 2025 numbers, and is current as of February of 2026. For last month’s report, check out our previous infographic!
Or follow this link for all our FVREB Infographics!
These infographics cover current trends in Fraser Valley neighbourhoods that are within the FVREB. Click on the images for a larger view!
Download Printable Version – FVREB Janaury 2026 Market Report

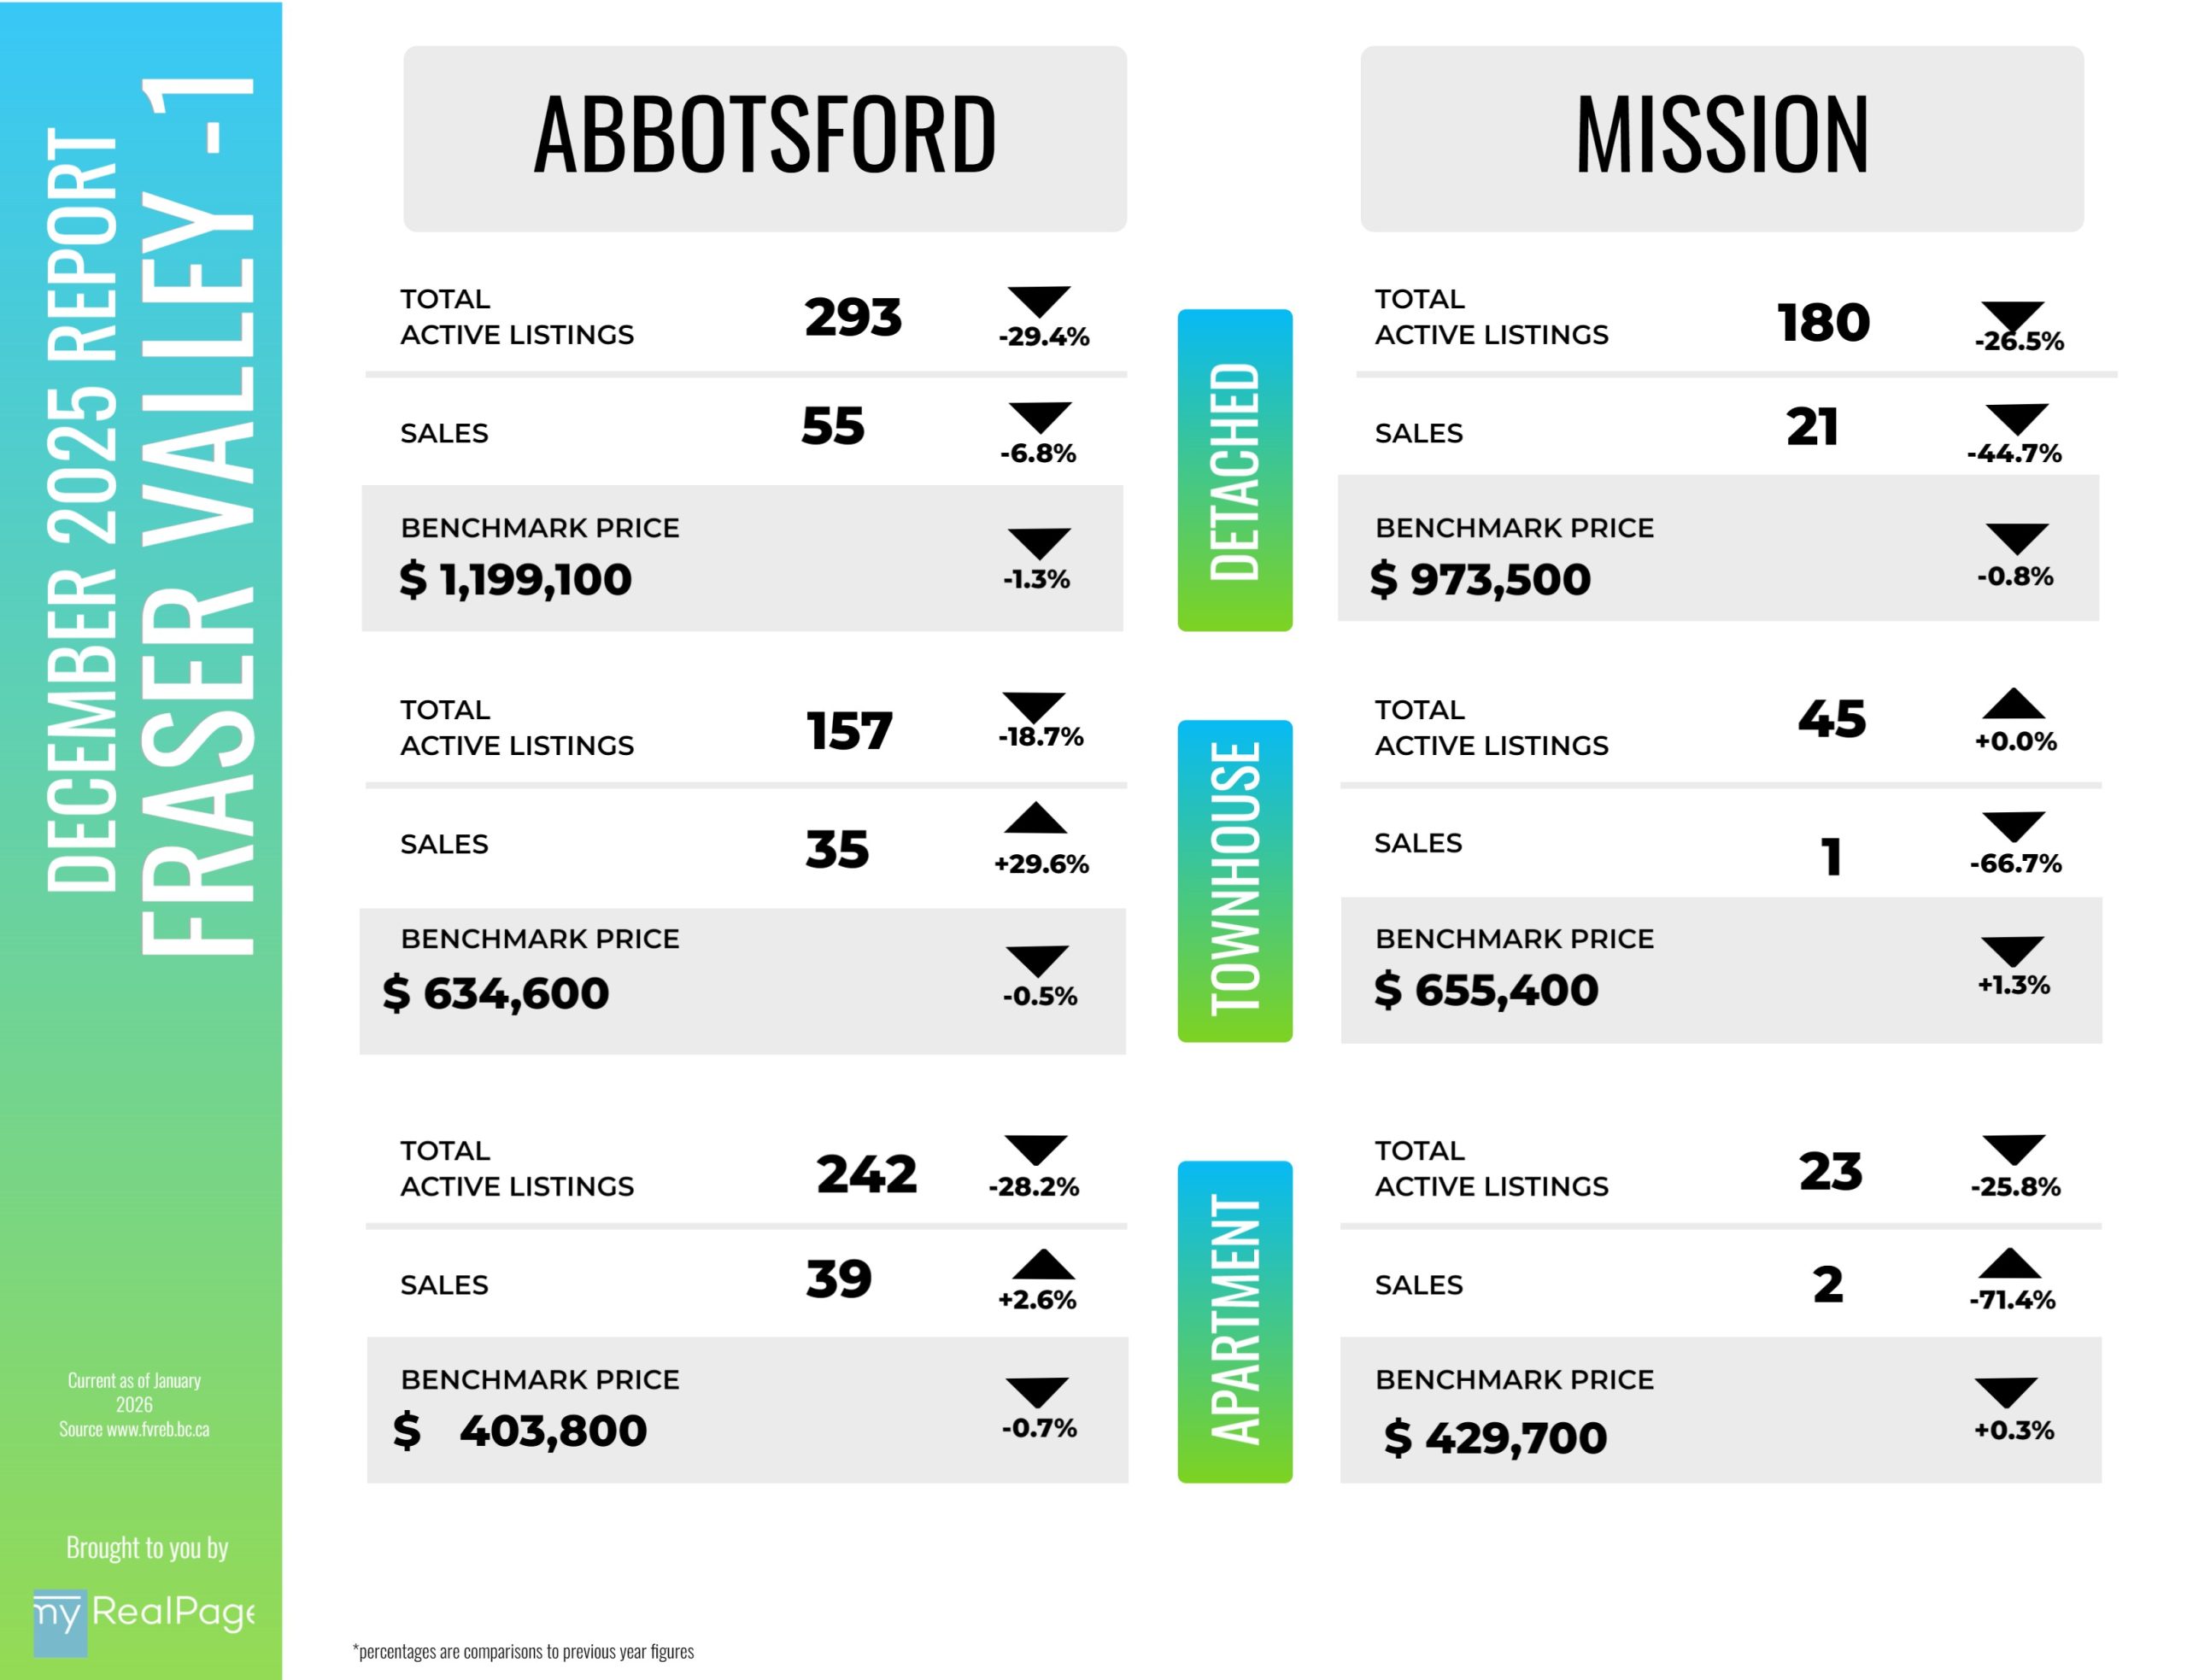
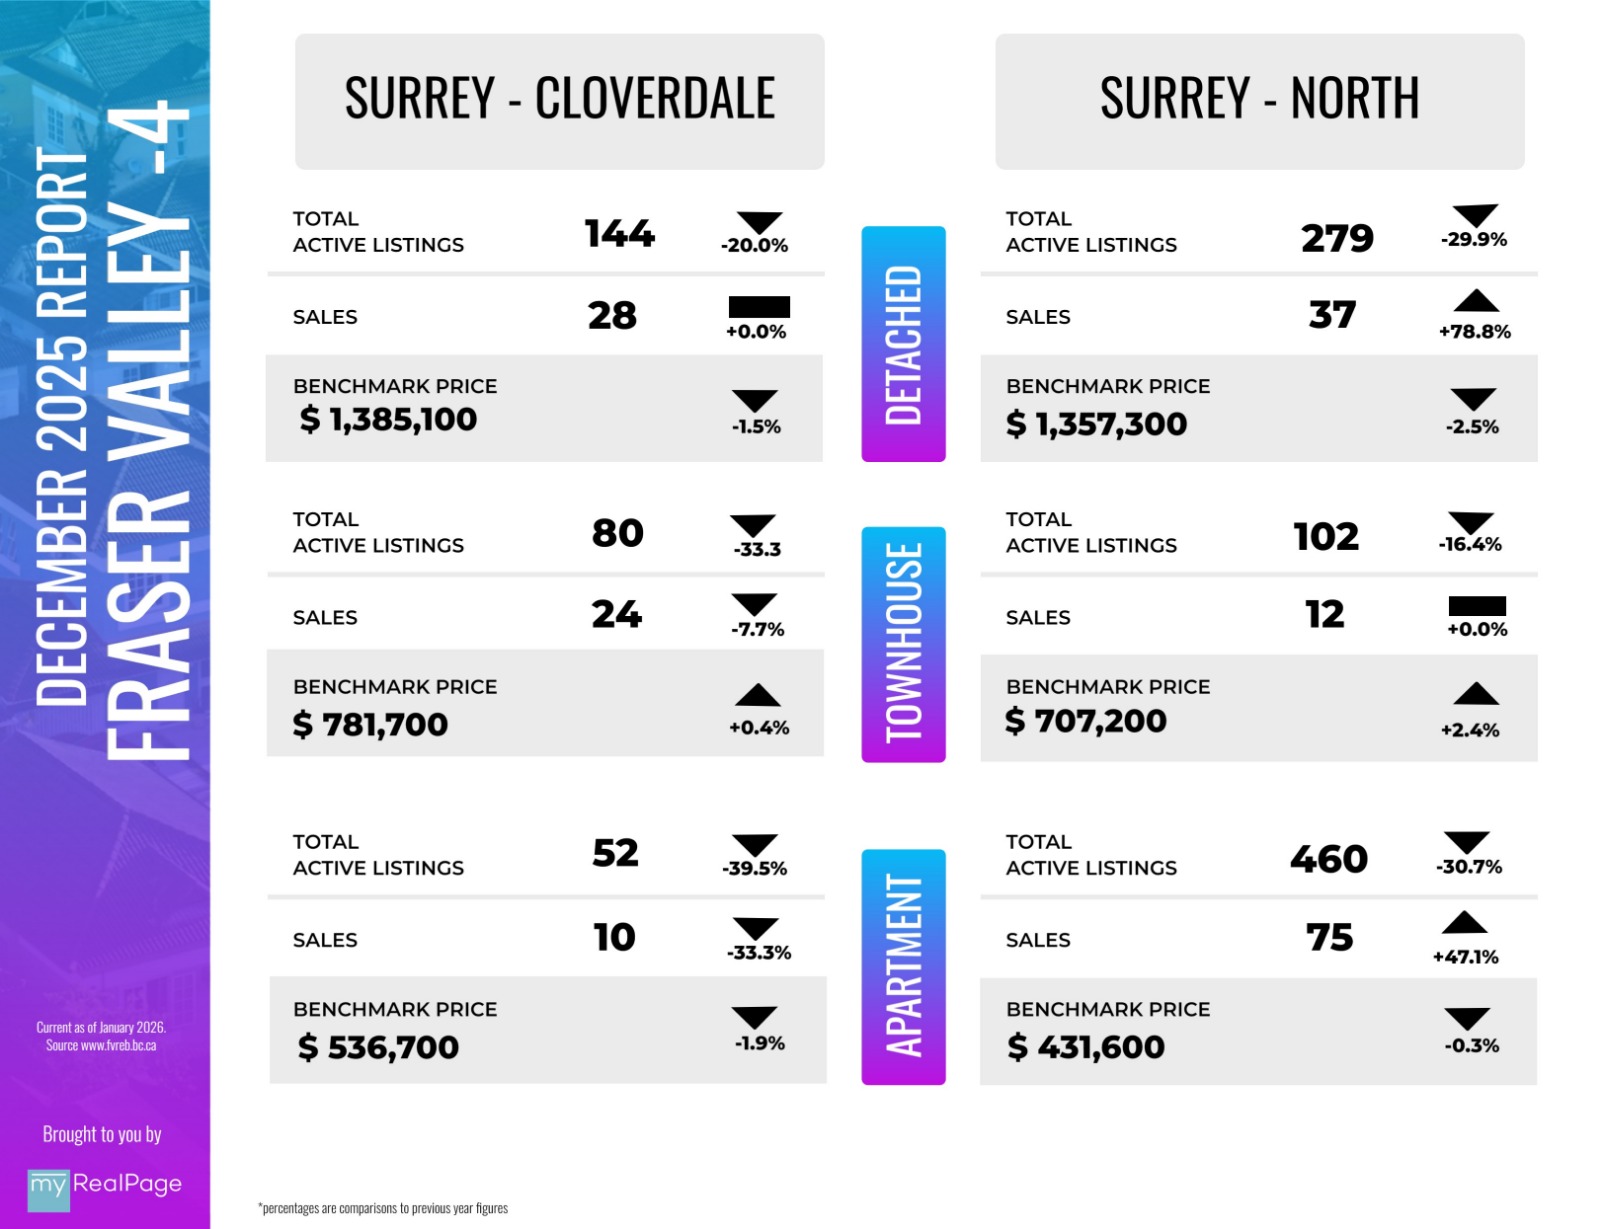
INFOGRAPHICS: December 2025 FVREB Fraser Valley Market Reports
2025 Fraser Valley housing market slowest in over two decades despite falling prices and decade-high inventory
Decade-high inventory and softer prices failed to spark buyer demand in the Fraser Valley in 2025. Despite favourable conditions and increased negotiating power, many buyers stayed on the sidelines, making it one of the slowest years for sales in decades.
The Fraser Valley Real Estate Board recorded 12,224 sales on its Multiple Listing Service® (MLS®) in 2025, a decline of 16 per cent over 2024 and 33 per cent below the 10-year average. The City of Surrey accounted for the majority of 2025 sales at 48 per cent, with Langley and Abbotsford accounting for 24 per cent and 16 per cent respectively.
On the supply side, buyers had more choice than at any point in the past four decades, as new listings climbed to 37,963.
The composite Benchmark home price in the Fraser Valley closed the year at $905,900, down six per cent year-over-year, and down 24 per cent from the peak in March 2022.
“Ample selection and easing prices gave buyers some of the most meaningful opportunities we’ve seen in recent years,” said Tore Jacobsen, Chair of the Fraser Valley Real Estate Board. “While these conditions favoured motivated sellers in 2025, the hesitancy of many buyers to capitalize reflected the general market climate throughout the province and indeed across the country.”
Read the full report on the FVREB website!
The following data is a comparison between December 2025 and December 2024 numbers, and is current as of January of 2026. For last month’s report, check out our previous infographic!
Or follow this link for all our FVREB Infographics!
These infographics cover current trends in Fraser Valley neighbourhoods that are within the FVREB. Click on the images for a larger view!
Download Printable Version – FVREB December 2025 Market Report


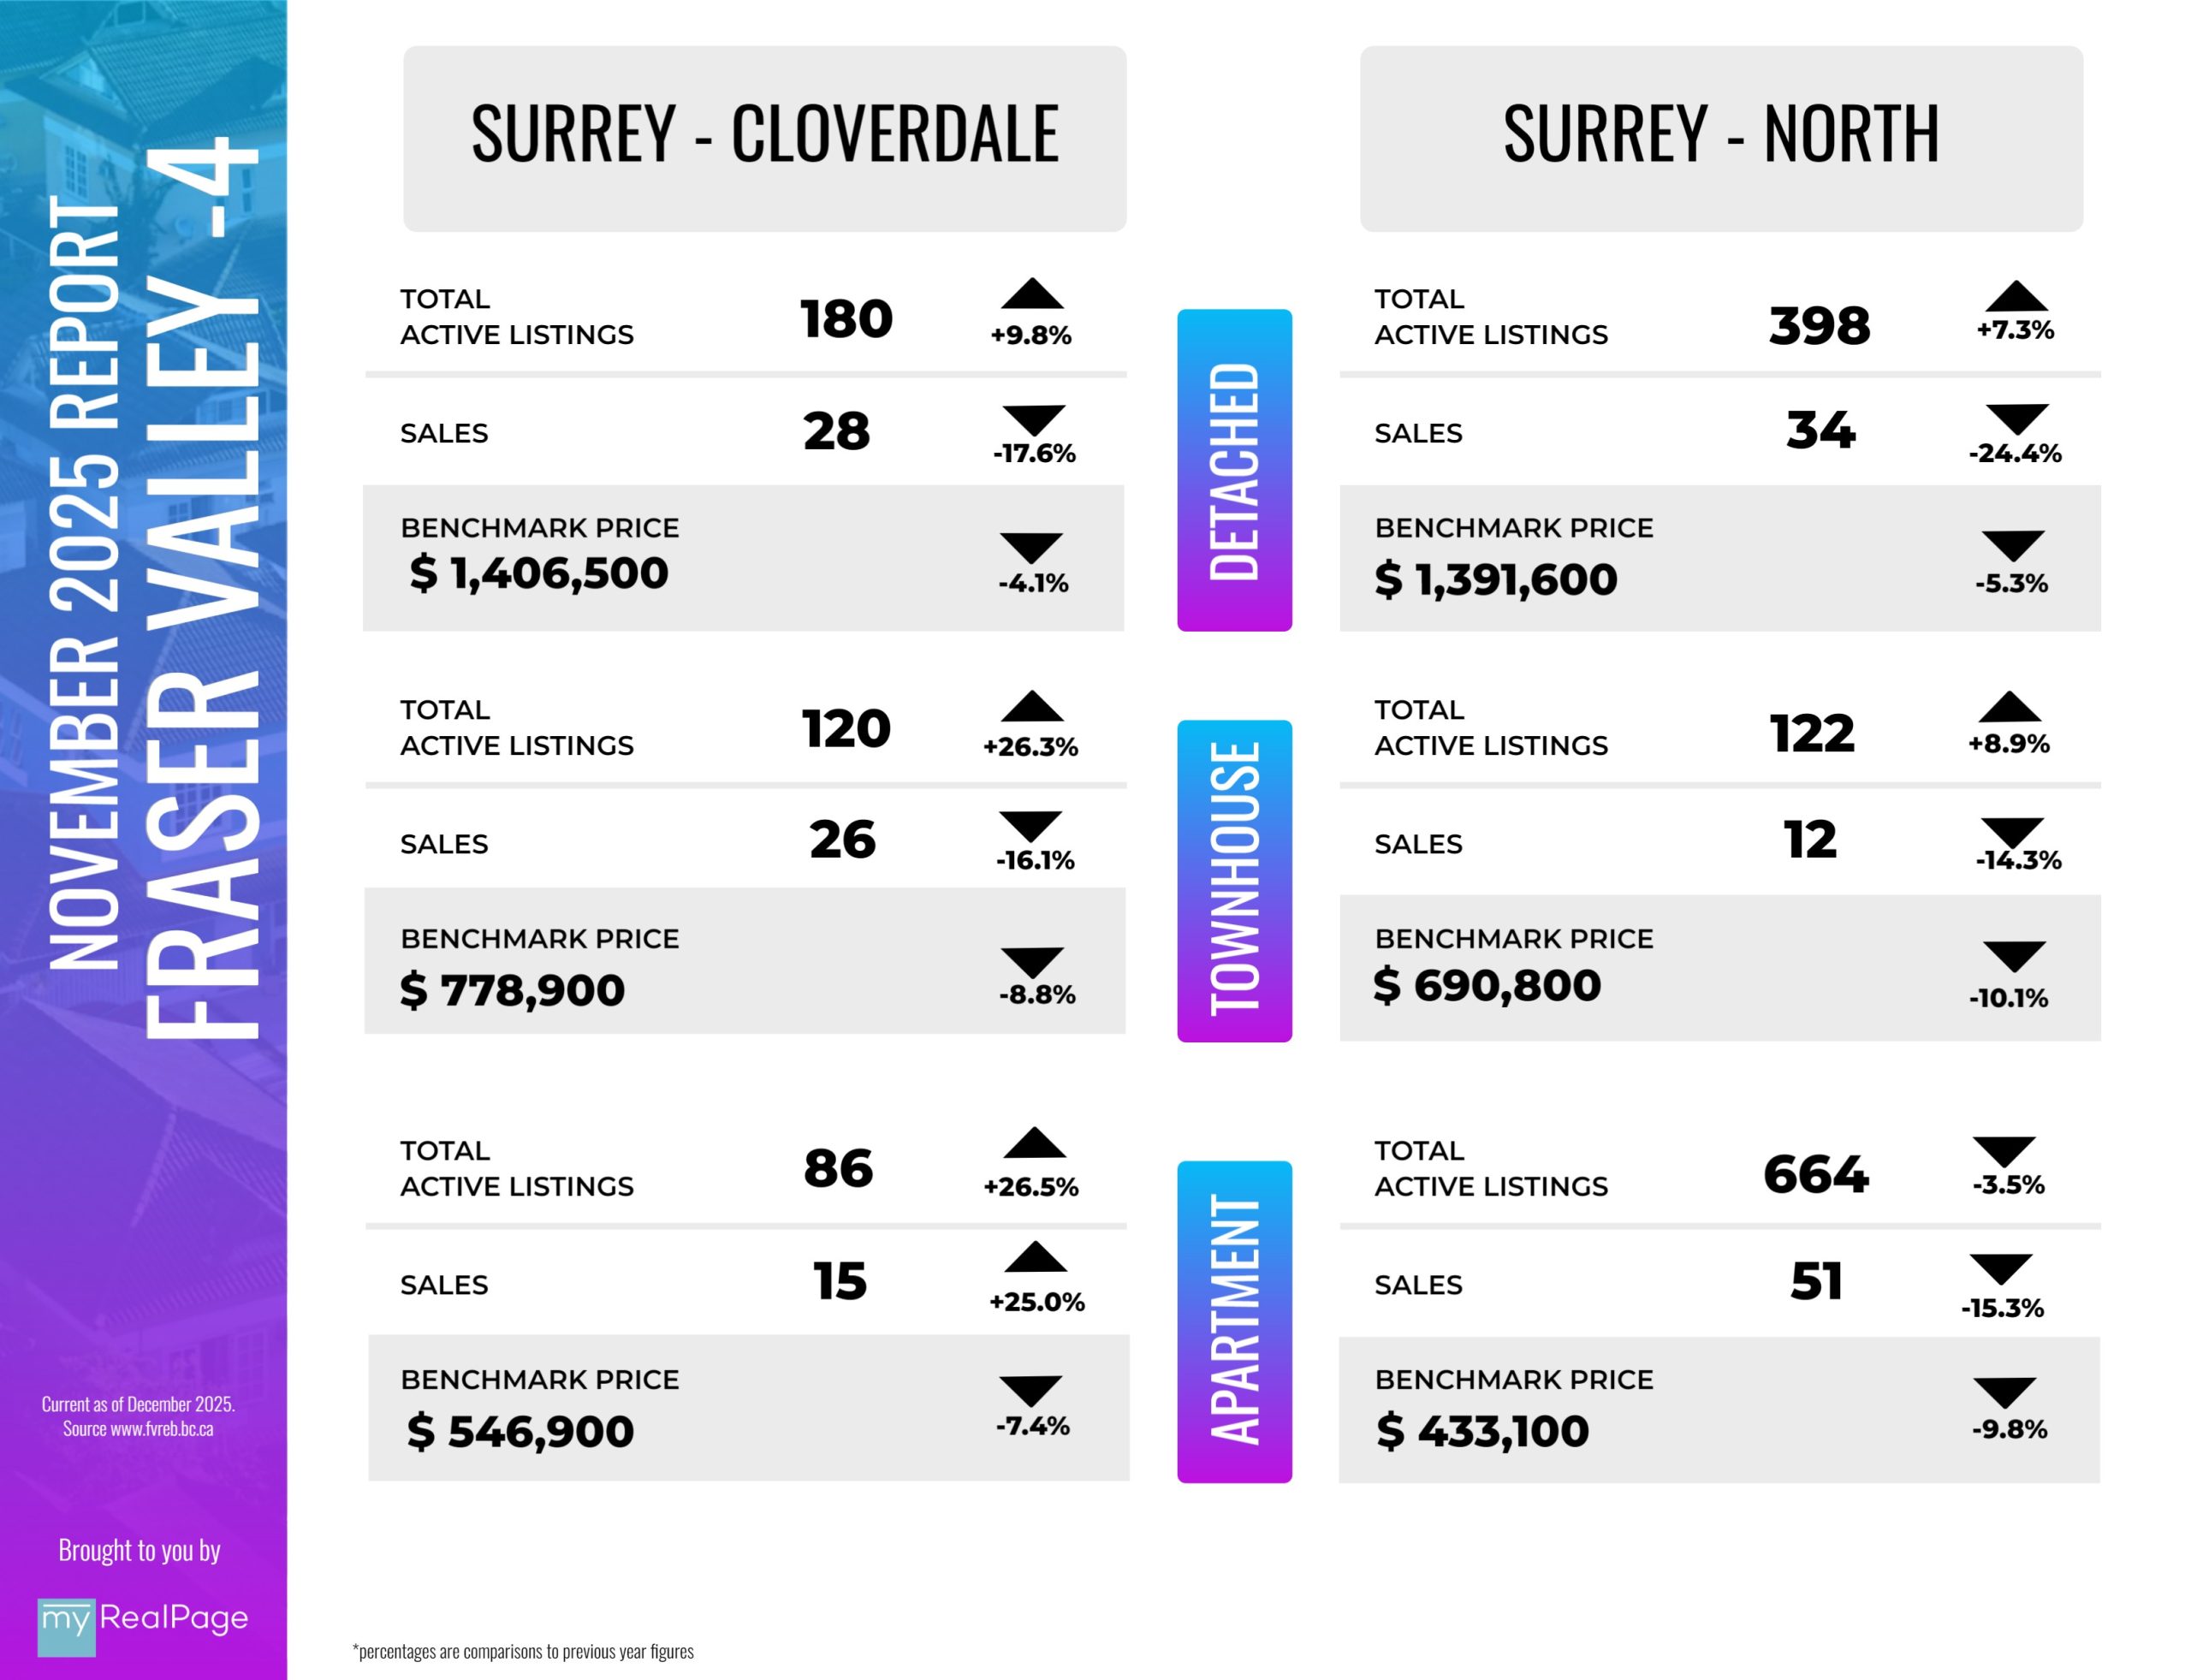
INFOGRAPHICS: November 2025 FVREB Fraser Valley Market Reports
Early fall momentum slows as Fraser Valley sales dip in November
Easing prices and abundant inventory weren’t enough to entice buyers to the Fraser Valley market in November, as sales declined in line with seasonal buying patterns.
The Fraser Valley Real Estate Board recorded 943 sales on its Multiple Listing Service® (MLS®) in November, a 16 per cent decrease from October, and 17 per cent below sales from the same month last year.
New listings slowed again in November, down 26 per cent month-over-month and seven per cent year- over-year, to 2,210. Overall inventory remains well above seasonal norms for the Fraser Valley, with 9,201 active listings, down nine per cent from October and 47 per cent above the 10-year seasonal average.
“Affordability concerns and economic pressures are weighing heavily on many Fraser Valley households,” said Tore Jacobsen, Chair of the Fraser Valley Real Estate Board. “Our REALTORS® understand how personal and complex these decisions are. But there are encouraging signs for buyers. Composite prices are closer to early-2023 levels, inventory has improved, and there is more space to negotiate than we’ve had in recent years.”
Read the full report on the FVREB website!
The following data is a comparison between November 2025 and November 2024 numbers, and is current as of December of 2025. For last month’s report, check out our previous infographic!
Or follow this link for all our FVREB Infographics!
These infographics cover current trends in Fraser Valley neighbourhoods that are within the FVREB. Click on the images for a larger view!
Download Printable Version – FVREB November 2025 Market Report


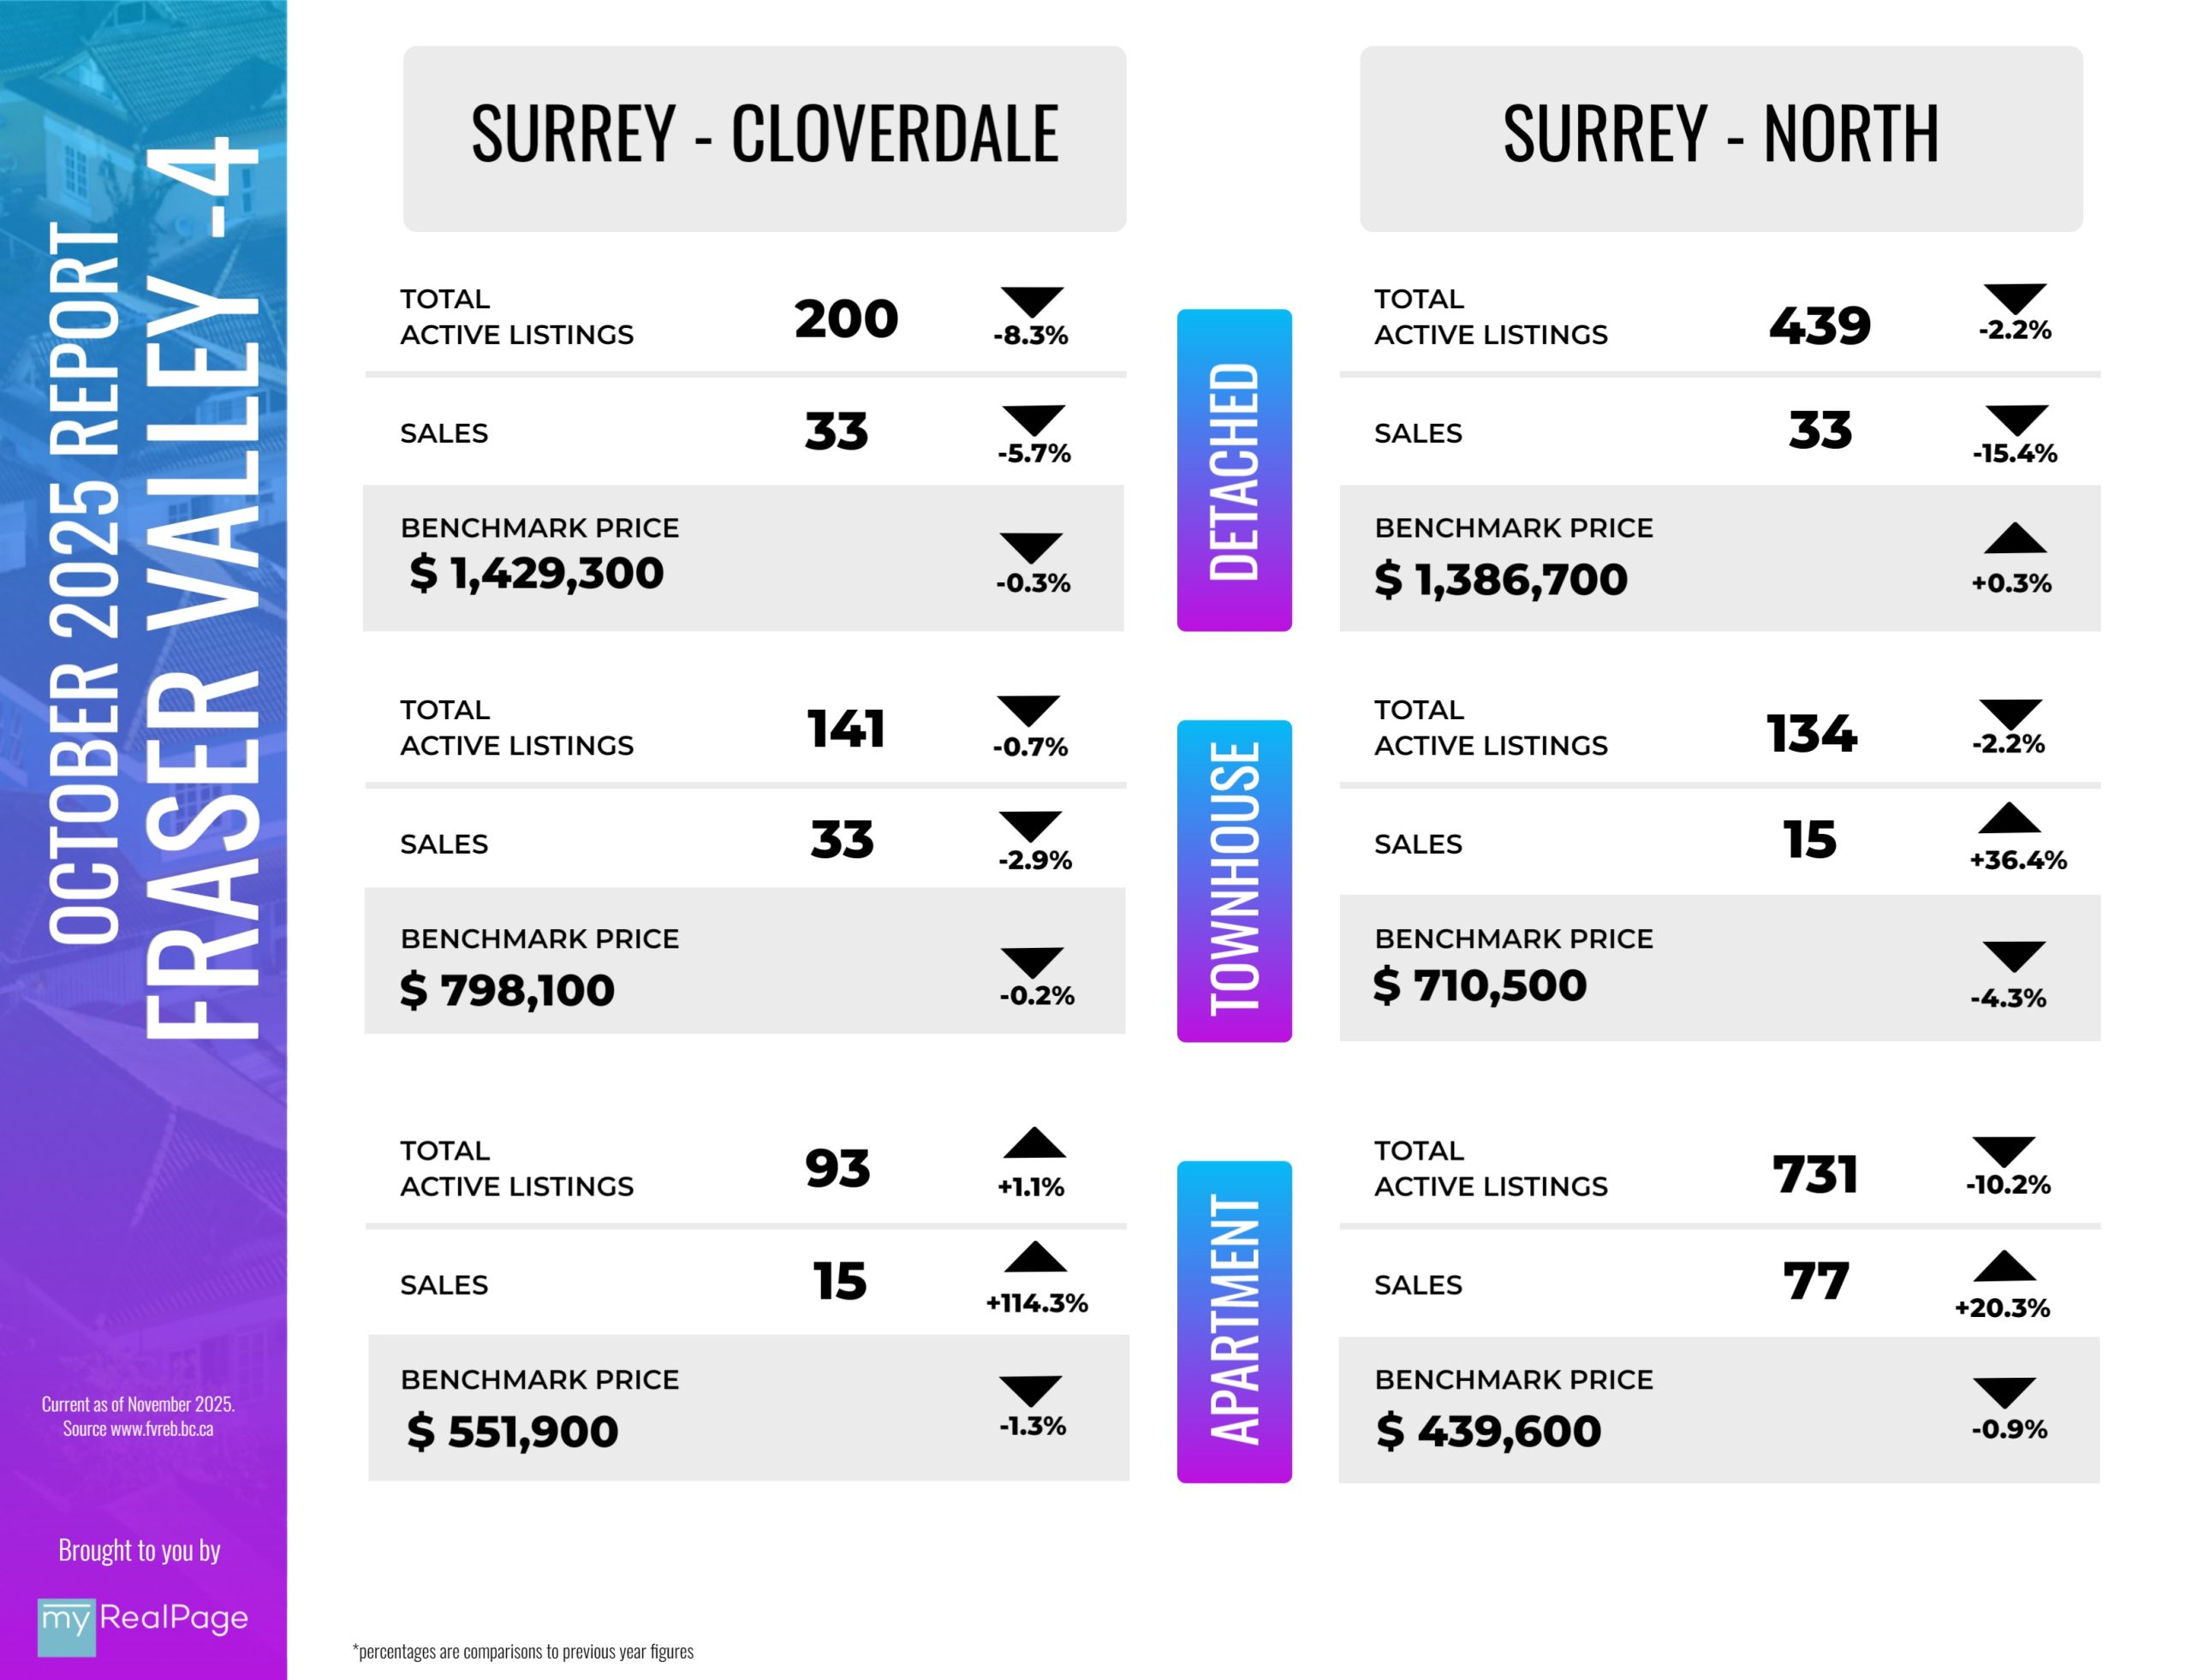
INFOGRAPHICS: October 2025 FVREB Fraser Valley Market Reports
October brings welcome boost to Fraser Valley, but sales still lag seasonal averages
Fraser Valley home sales climbed for the second straight month in October, a sign that some buyers may be responding to steadily easing prices.
The Fraser Valley Real Estate Board recorded 1,123 sales on its Multiple Listing Service® (MLS®) in October, a 17 per cent increase from September, but 16 per cent below sales from the same month last year. After a short-lived rise in September, new listings slowed in October, down 14 per cent month-over-month and seven per cent year-over-year, to 2,967. Overall inventory remains well above seasonal norms for the Fraser Valley, with 10,121 active listings, down four per cent from September but up 15 per cent year-over-year.
“Motivated sellers are responding to increasingly competitive market conditions with more realistic pricing strategies,” said Tore Jacobsen, Chair of the Fraser Valley Real Estate Board. “As a result, we’re seeing prices soften—a shift that’s helping to facilitate sales in a slower market.”
Read the full report on the FVREB website!
The following data is a comparison between October 2025 and October 2024 numbers, and is current as of November of 2025. For last month’s report, check out our previous infographic!
Or follow this link for all our FVREB Infographics!
These infographics cover current trends in Fraser Valley neighbourhoods that are within the FVREB. Click on the images for a larger view!
Download Printable Version – FVREB October 2025 Market Report


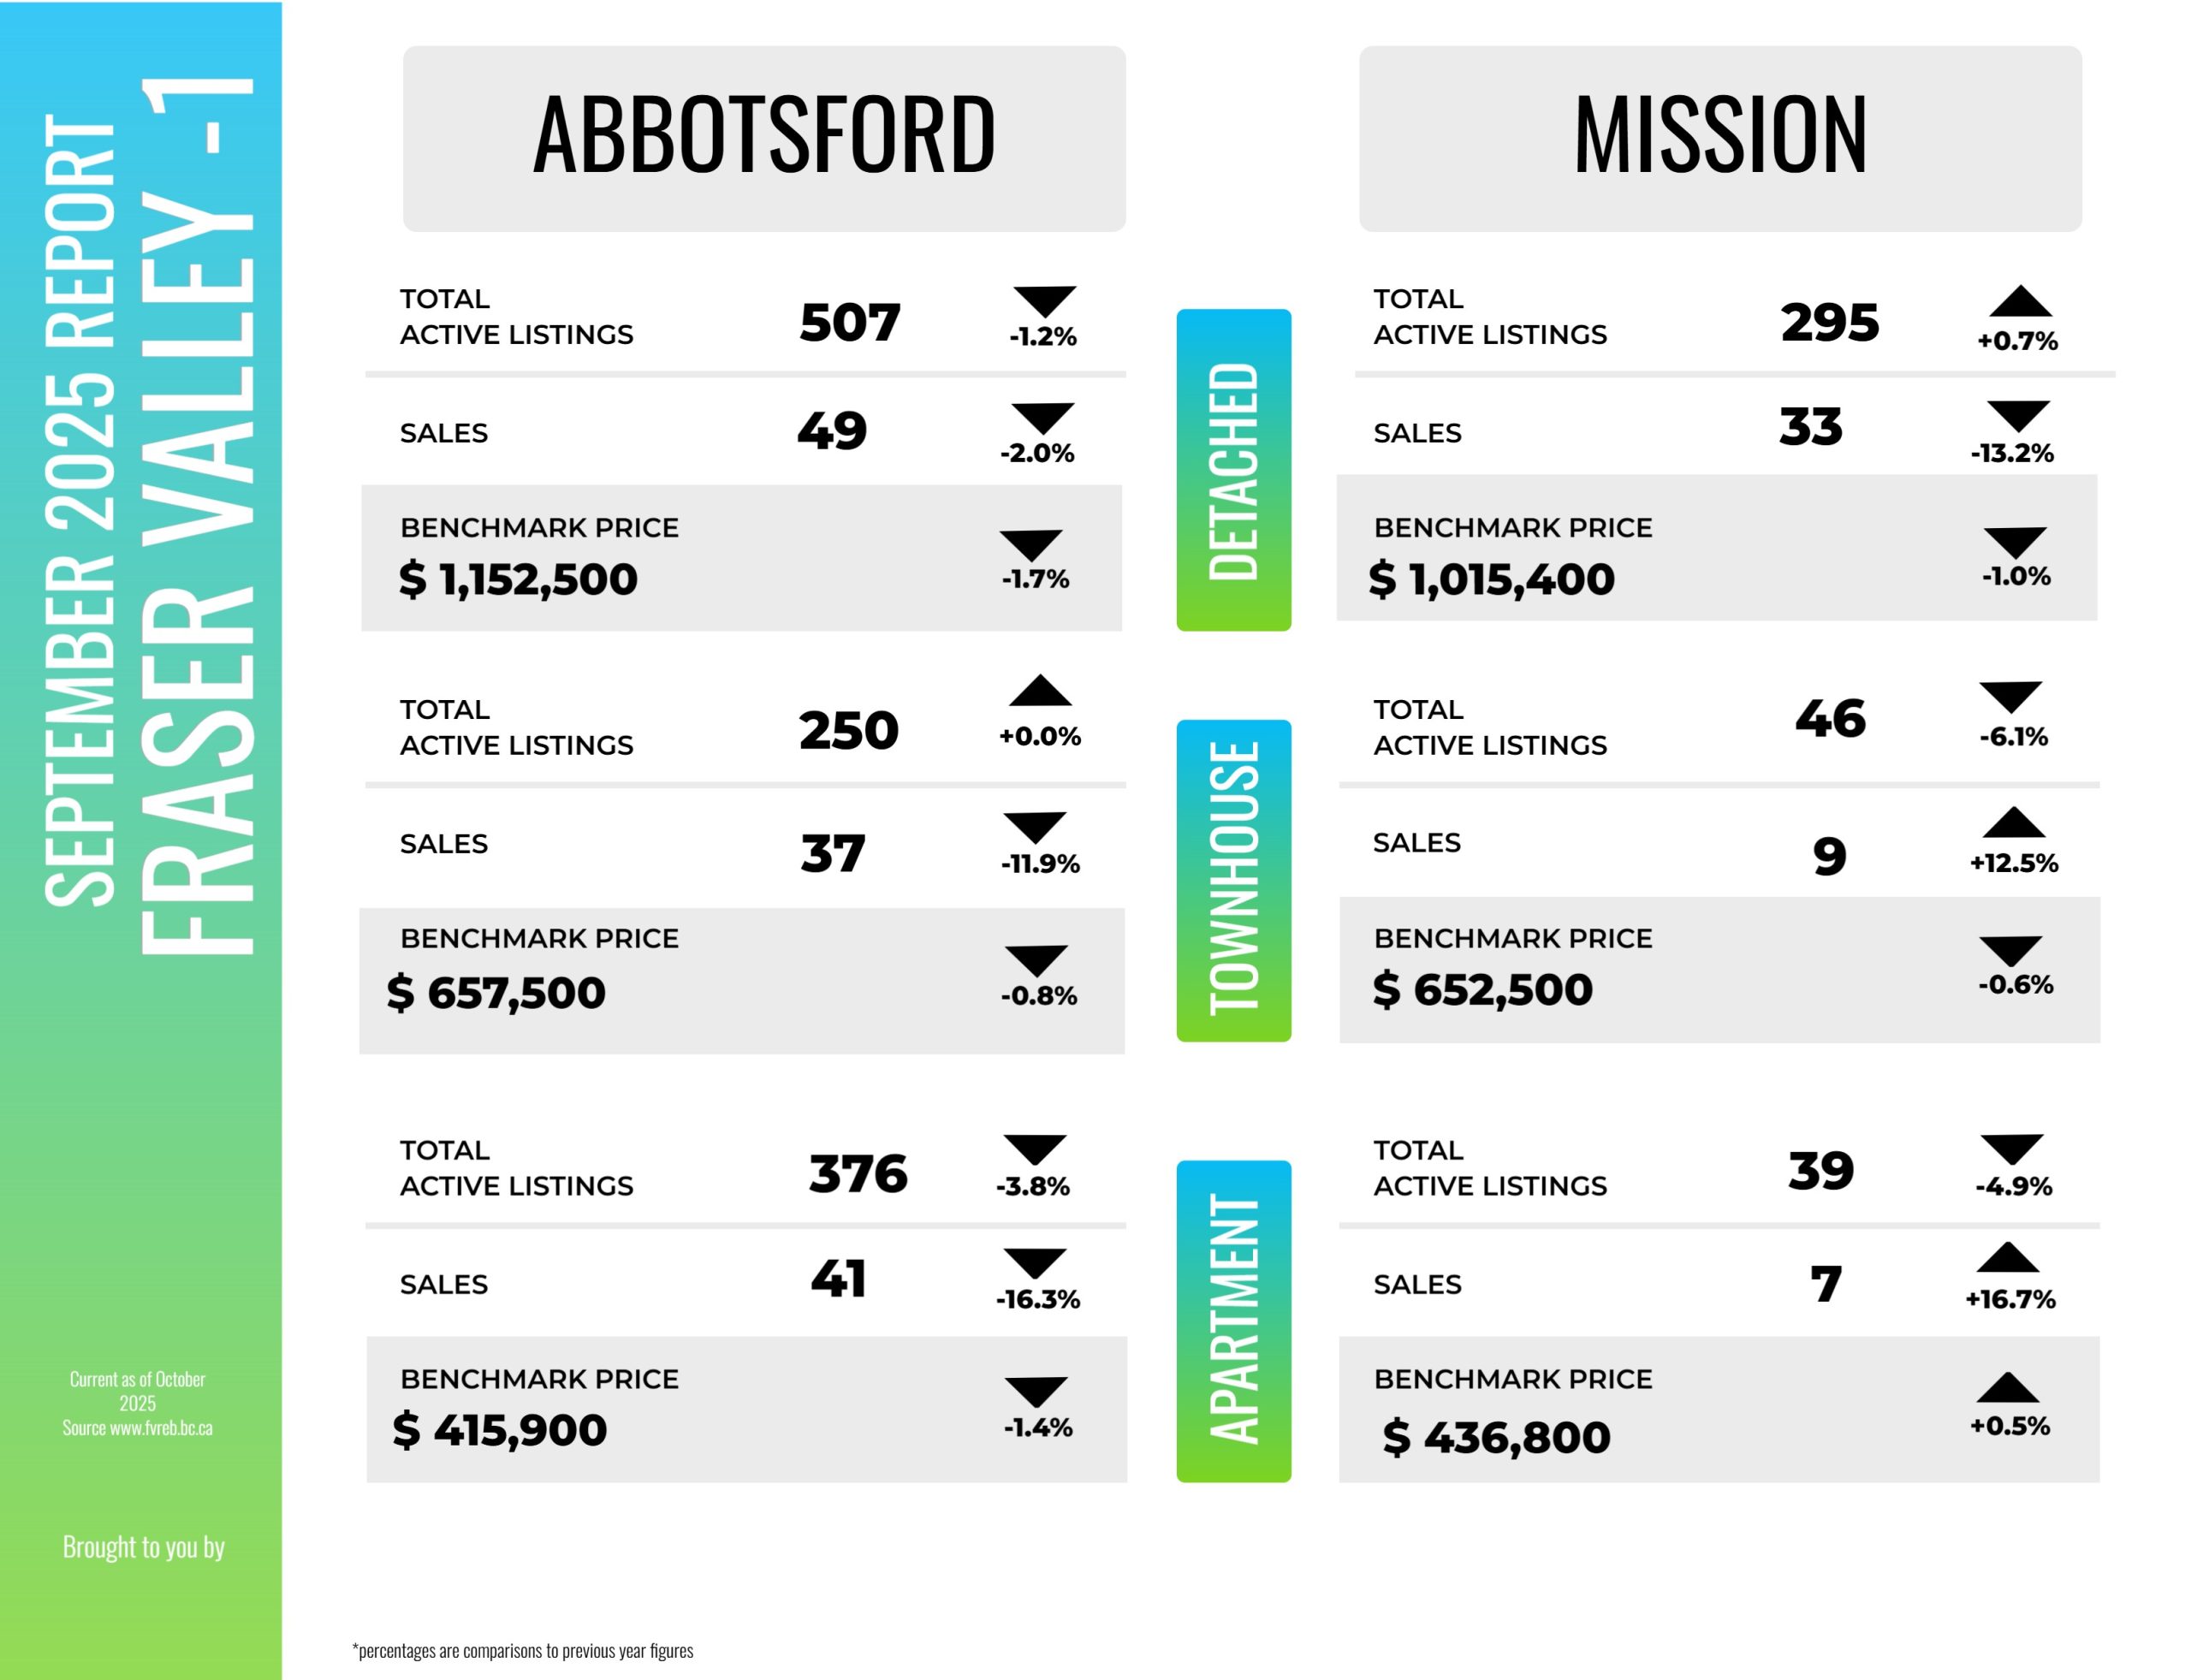
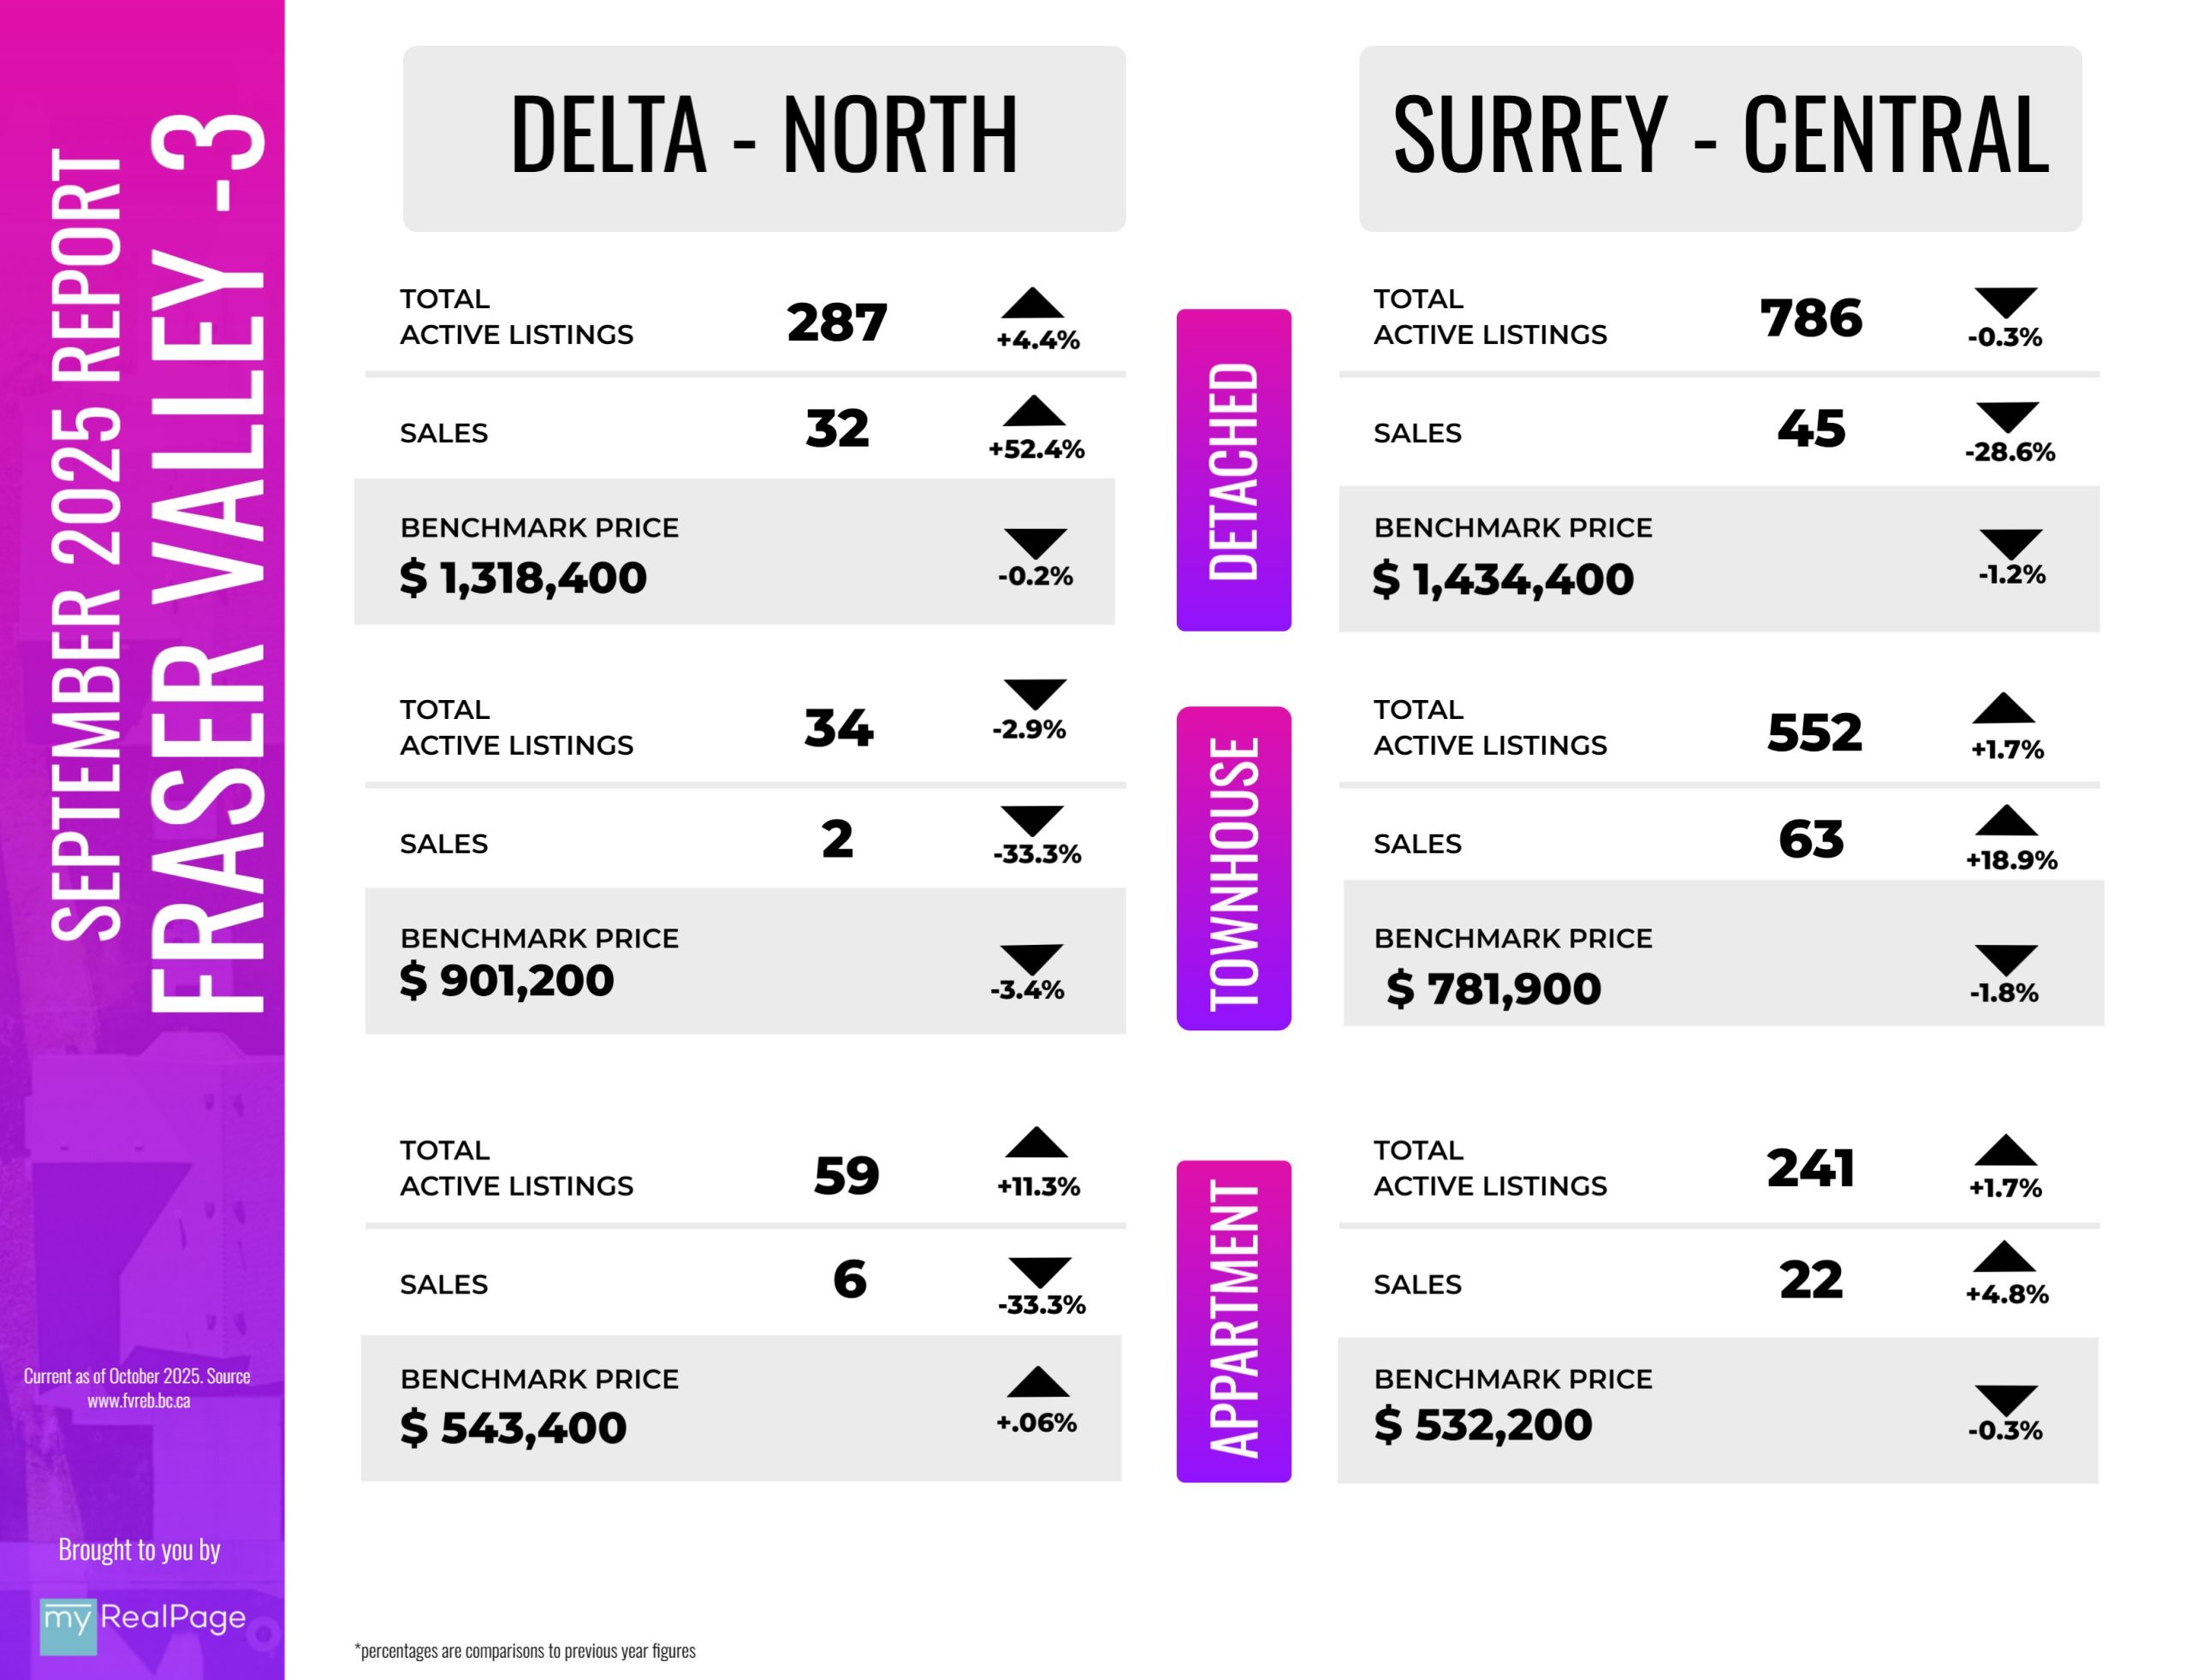
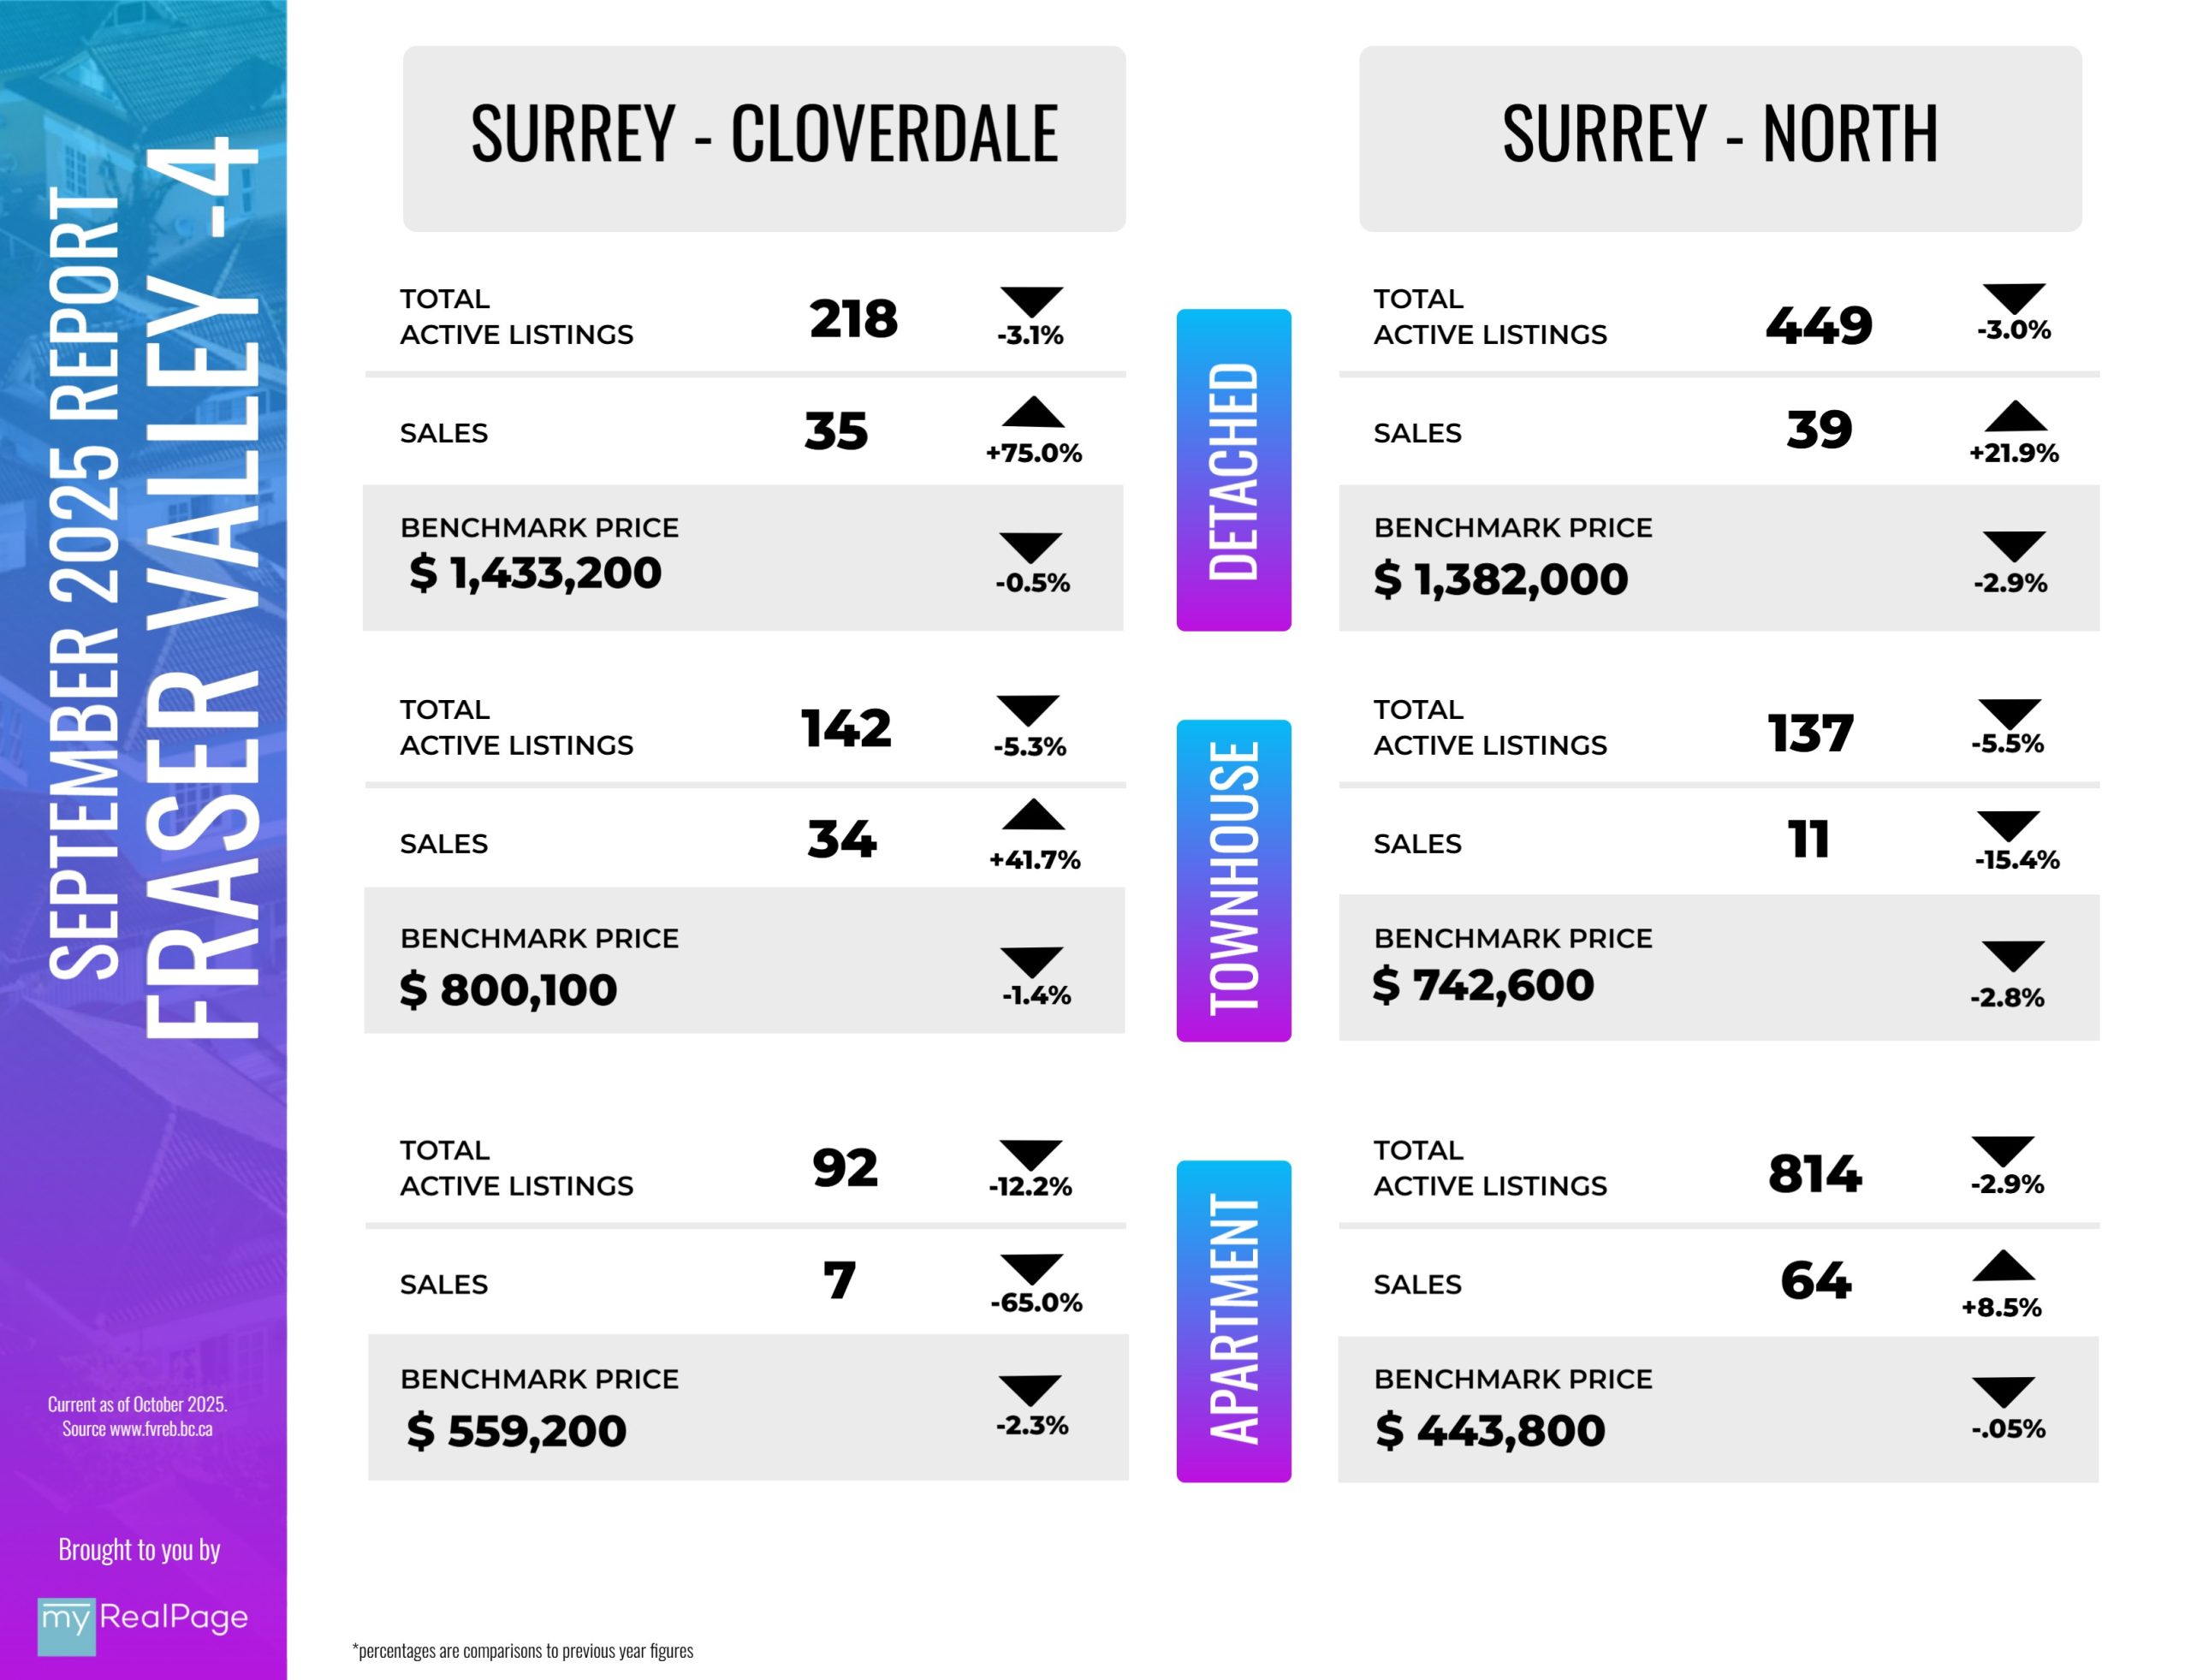
INFOGRAPHICS: September 2025 FVREB Fraser Valley Market Reports
Sustained elevated inventories soften Fraser Valley home prices further, spurring bump in sales
Home prices in the Fraser Valley continued their downward trend in September, marking the sixth straight month of declines, amid high inventory.
The Benchmark price for a typical home in the Fraser Valley dropped one per cent in September to $926,300, down 5.4 per cent year-over-year. The continued softening of prices may be encouraging some buyers back into the market, as the Fraser Valley Real Estate Board recorded 962 sales on its Multiple Listing Service® (MLS®) in September, an increase of three per cent over August. September sales were down two per cent year-over-year and 28 per cent below the 10-year average.
“As prices continue to weaken, the market is showing hopeful signs of renewed confidence,” said Tore Jacobsen, Chair of the Fraser Valley Real Estate Board. “While recent economic uncertainty seems to have weighed more heavily here in the Fraser Valley, some buyers are beginning to re-engage in the market, a positive signal heading into the fall.”
Read the full report on the FVREB website!
The following data is a comparison between September 2025 and September 2024 numbers, and is current as of October of 2025. For last month’s report, check out our previous infographic!
Or follow this link for all our FVREB Infographics!
These infographics cover current trends in Fraser Valley neighbourhoods that are within the FVREB. Click on the images for a larger view!
Download Printable Version – FVREB September 2025 Market Report


#1 1920 152 Street
White Rock, BC, CANADA
V4A 4N6